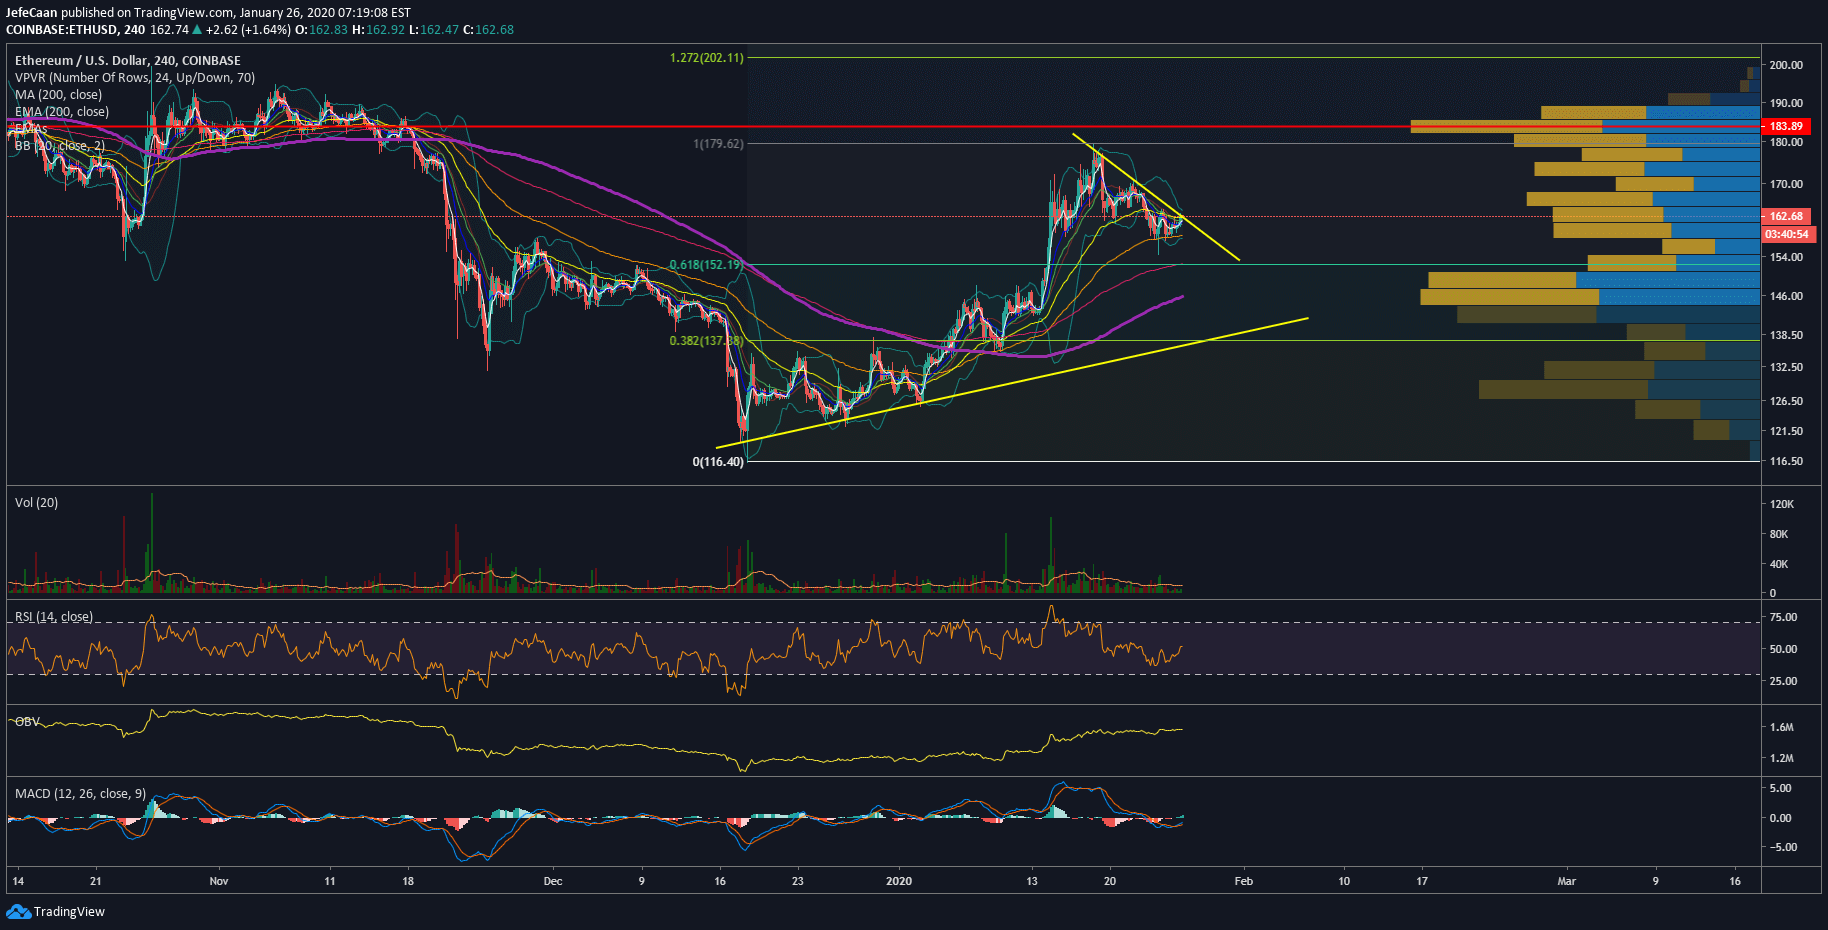
Ethereum (ETH) is ready to decline further now that it has tested the 200-day moving average. The next support is around $152 but ETH/USD is likely to break it considering it will have to decline much lower to test the trend line support. This trend line support is likely to be the ramp for Ethereum (ETH) to potentially shoot up before the next halving. In my opinion this will be a major bull trap that will catch a lot of traders off guard. For now, it seems too easy to be bullish on the market just before the next halving. Everyone is hoping for the price to shoot up and therefore a lot of people will end up buying retracements on the way down.
We can see now on the 4H chart that the price has begun its descent and has faced multiple rejections at the trend line resistance. It is expected to continue to fall lower along this path till it reaches the trend line support. It is also clear that by the time the price reaches the trend line support, it will do so slightly above the 38.2% fib level. However, horizontal lines take precedence over trend lines and therefore we might see a move down to the $137 level for the price to find horizontal support before it starts to rally. At this point, the vast of majority of traders and analysts in this market need a higher high and a higher low which the market makers and the whales are expected to give to them to make them confident in their beliefs that the market is going to rally before the upcoming halving.
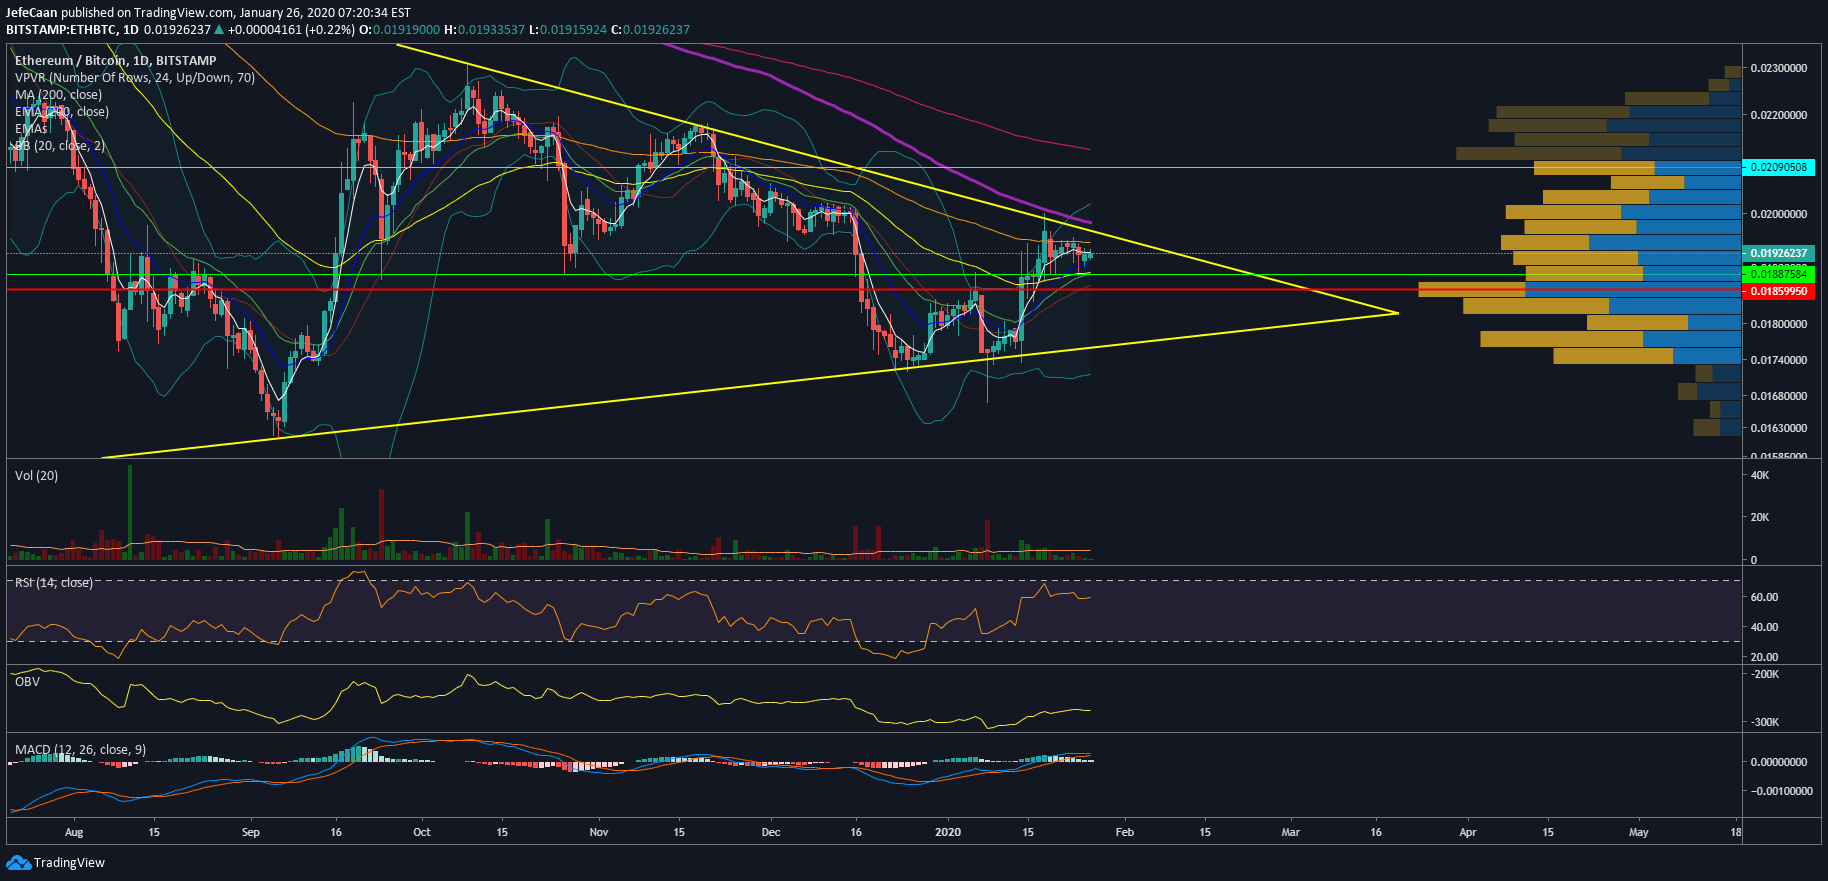
Ethereum (ETH) is still trading within a symmetrical triangle against Bitcoin (BTC). It has yet to break out of this triangle which is going to be the key event that will set ETH/BTC on a definitive course for the weeks and months ahead. So far, this pair has not tested the 200-day moving average which makes us confident in believing that the market may be headed for another uptrend after near-term correction. That being said, it is also very probable that a move to the upside out of this symmetrical triangle will likely be a fakeout.

The cryptocurrency market risks to lose a lot more if the stock market begins to decline. Altcoins like Ethereum (ETH) will experience the most pain. With the uncertainty surrounding the Trump impeachment trial, many indicators are shaping up to point to a downtrend in bigger markets like the stock market and currency markets like the EUR/USD forex pair. None of this bodes well for cryptocurrencies. This is the first time WTI Crude Oil (USOIL) has closed below the 200 moving average in the14 weeks. We may yet see some pre-halving bull traps in the market but it is not worth the risk/reward to be chasing any such moves because conditions are lining up to indicate that we may see a 2018 styled downtrend once again.