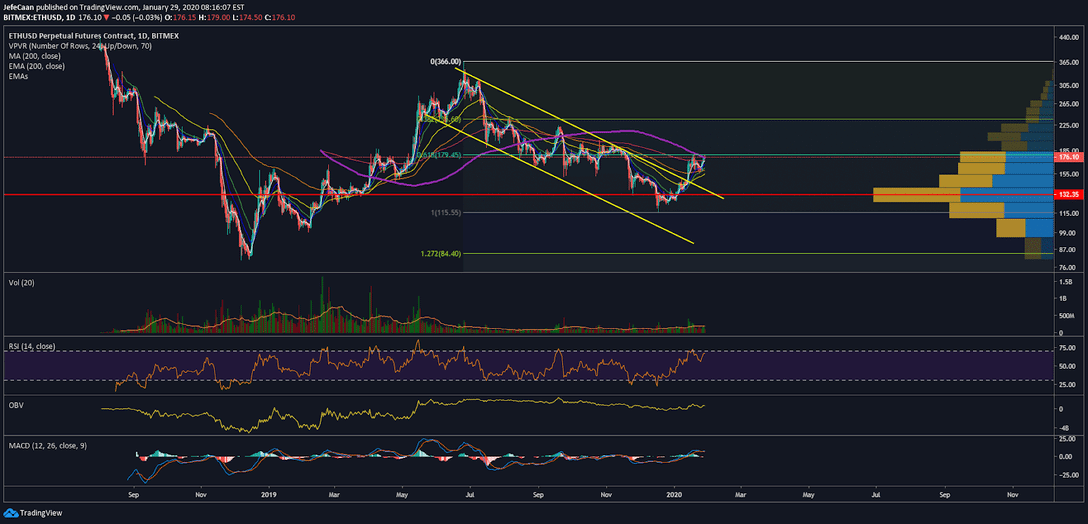
Ethereum (ETH) has broken a descending channel and has shot towards the 200-day moving average once again. This “broken” descending channel is something you would see more and more analysts and traders talk about in the near future. However, we only have to go a few months back to see that the exact same thing has happened before! We have seen similar descending channels being broken and the price has declined after. So, what does this mean? Simply put, it means that a trend line resistance only gives us insights as to a single trend. If the trend line resistance is broken, the price could continue to decline again under a similar trend once again.

This is a mistake that even some good investors in this market make too often. They are too early to call a break of the descending channel only to see the price fall back into the channel. By then, most of us don’t realize when they change their trend lines to adjust to the new trend. So, it is therefore important to focus more on horizontal S/R lines and fib retracement levels. We can see on the daily chart for ETH/USD that the price has run into the 61.8% fib retracement level at the same time that it has tested the 200-day moving average. It is important to wait and see how the price trades from here on out because it is now at a turning point. This is not a point where good traders enter positions, be it bullish or bearish.
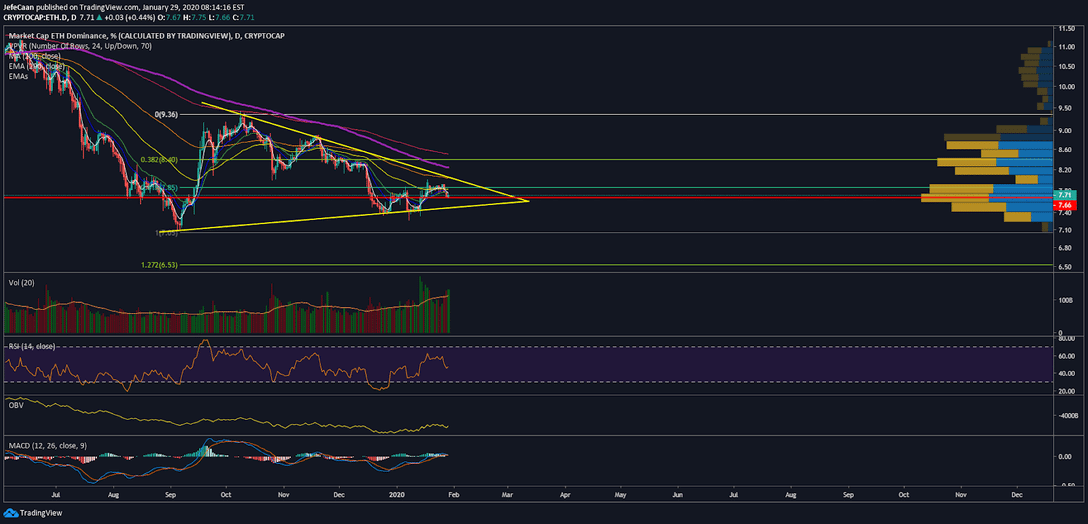
The daily chart for Ethereum dominance (ETH.D) also shows us how Ethereum (ETH) has not made the decision just yet. This is why we need to wait and see what happens after. If you are a good trader, you could ride the waves up and down while Ethereum dominance (ETH.D) trades within the symmetrical triangle. However, it is not advisable because things could change quickly in this market especially with important political and economic developments up ahead.
One thing that is important to realize is that if Bitcoin dominance (BTC.D) shoots past the 70% level this time to rally towards higher level out of the ascending triangle on the daily chart for Bitcoin dominance (BTC.D), it will be the beginning of a very painful period for the altcoin market. A large number of Ethereum based tokens would be forced to close shop or for their development teams to abandon working on them. As enticing as it may seem to long or short the market depending on whether you are a bull or a bear, it is always important for confirmation rather than risking it all on that small 5% move which would be inconsequential in the grand scheme of things.