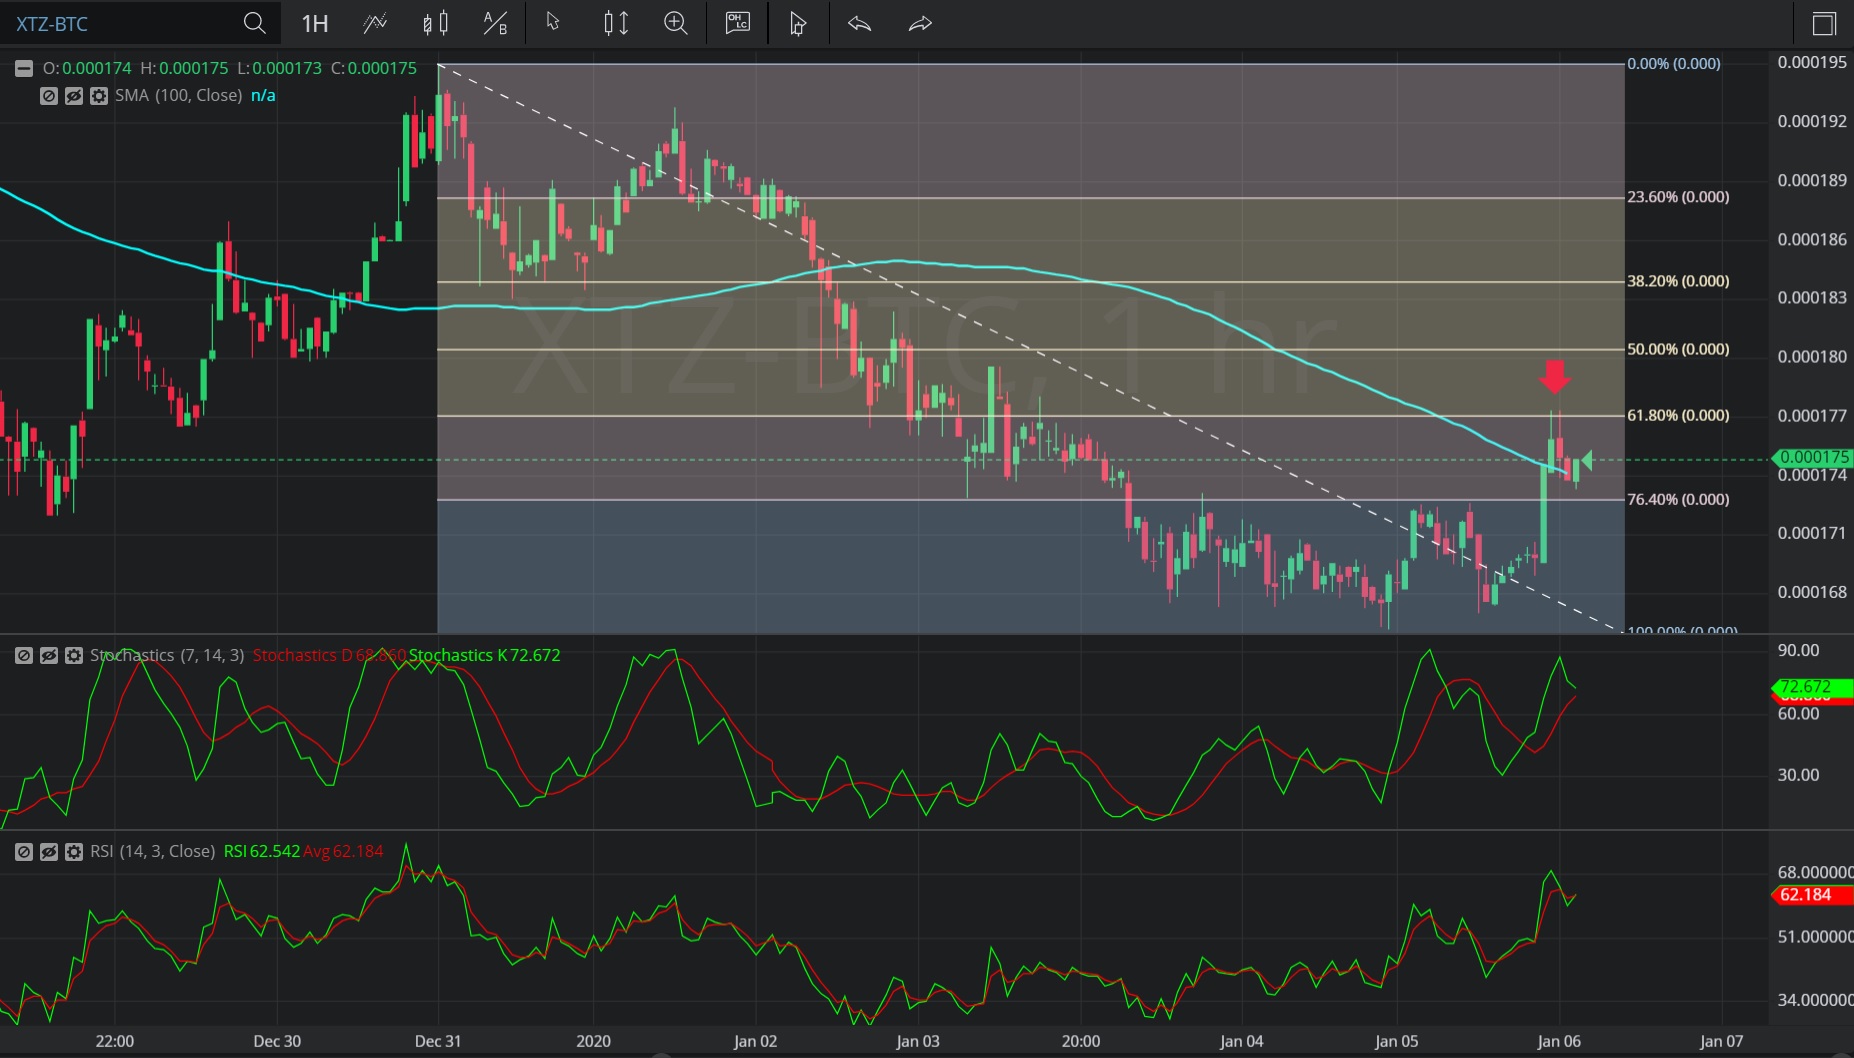
In this Hourly chart of Tezos/ Bitcoin Coin (XTZ/ BTC), there is a depreciating range from 0.000195 to 0.000166.
We can observe that the market then appreciated to the 0.000177 level (identified by the red down arrow), just above the 0.00017707 level that represents the 38.2% retracement of the depreciating range.
We can observe that the 0.00017707 level was above the 0.000175 level, the area where the 100-bar Simple Moving Average was indicating at the time.
The market then depreciated to the 0.000173 level.
Using RSI, we can observe that the slope of RSI (14) turned negative after the market traded as high as the 0.00017707 level, and that RSI Average (3) bearishly crossed above RSI (14) thereafter. RSI (14) has since moved above RSI Average (3), suggesting a possible end to the depreciation.
Using Slow Stochastics, we can observe that the slope of Stochastics K bearishly turned negative after the market traded as high as 0.00017707. Stochastics K and Stochastics D have not yet crossed, hence the entry signal has not been fully confirmed yet.
Stay on top of the cryptocurrency market with CryptoDaily’s trading charts!