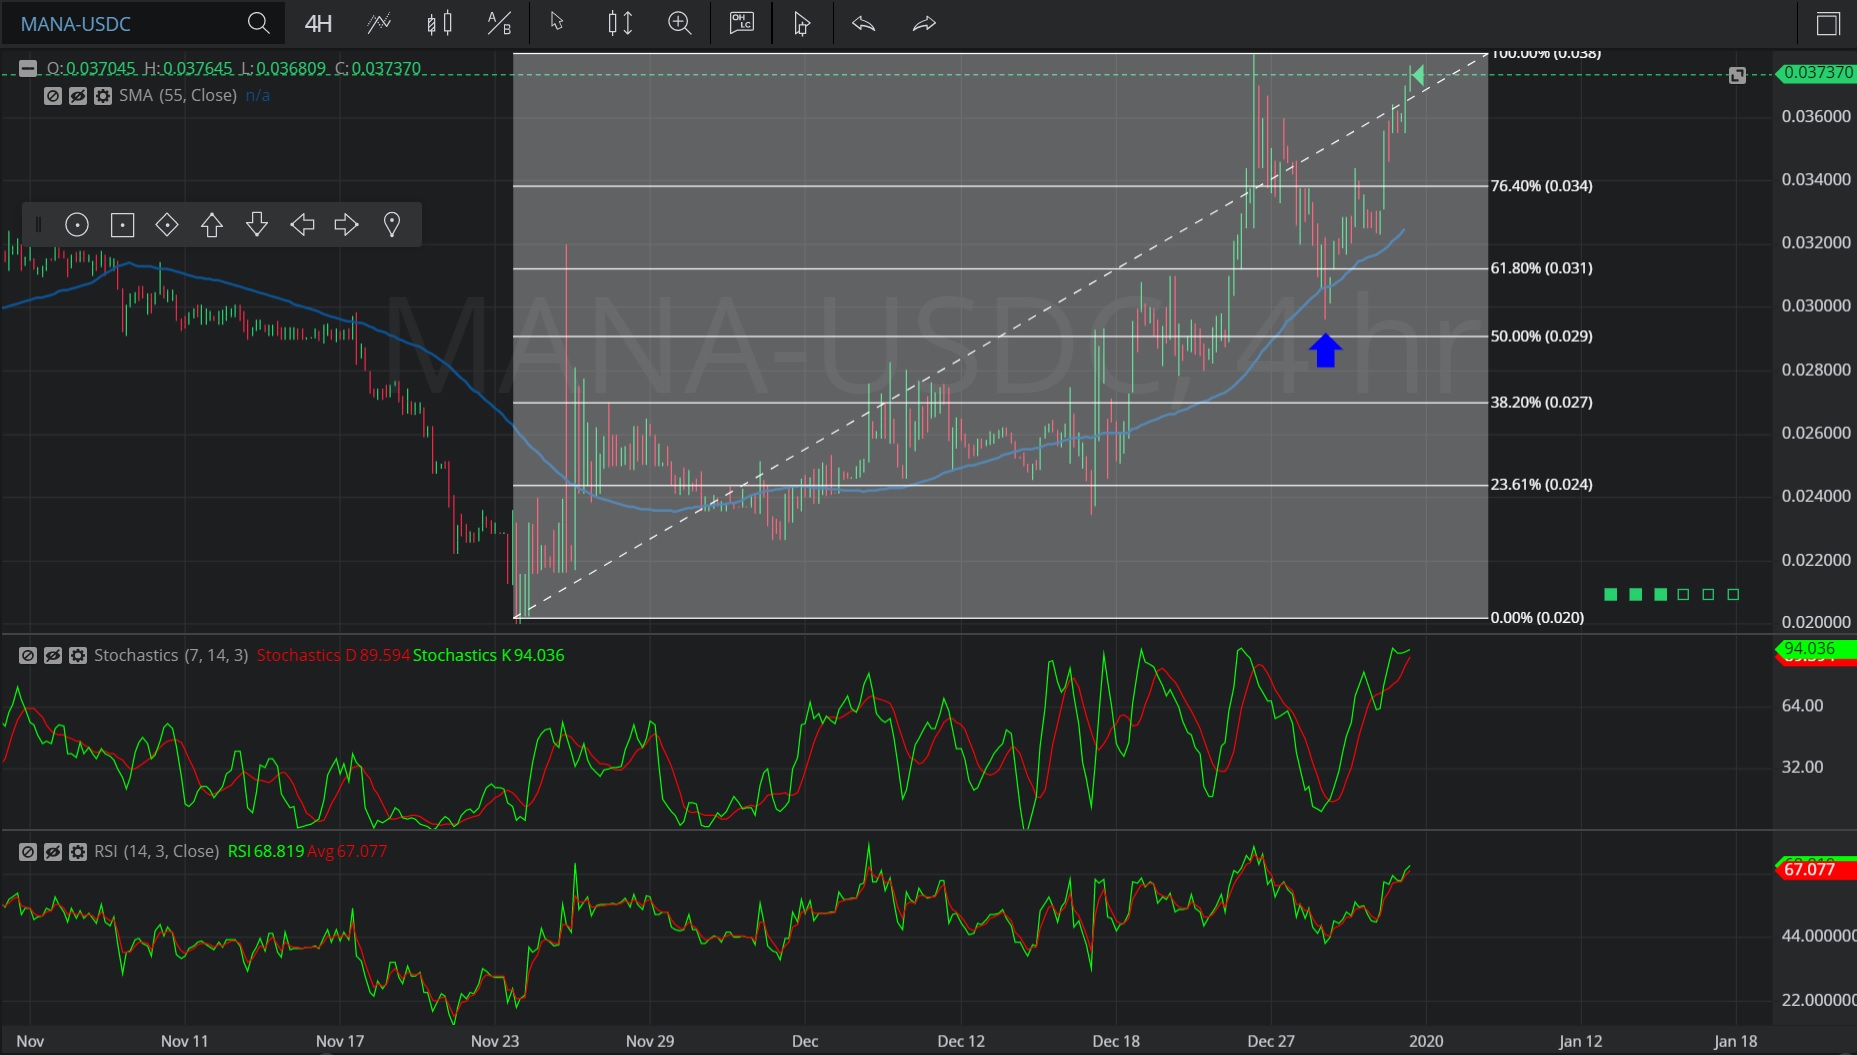
In this 4-hourly chart of Decentraland/ United States dollar Coin (MANA/ USDC), there is an appreciating range from 0.02 to 0.038.
We can observe that the market then depreciated to the 0.029634 level (identified by the blue up arrow), just above the 0.029 level that represents the 50% retracement of the appreciating range.
We can observe that the 0.029634 level was just below the 0.030601 level, which is where the 55-bar Simple Moving Average was indicating.
The market then appreciated to the 0.037645 level and continues to appreciate.
Using RSI, we can observe that the slope of RSI Average (3) turned positive after the market traded as low as the 0.029634 level, and that RSI (14) then bullishly crossed above RSI Average (3). RSI (14) continues to indicate above RSI Average (3), indicating continued price appreciation.
Using Slow Stochastics, we can observe that Stochastics K bullishly crossed above Stochastics D after the market traded as low as the 0.029634 level, and that the slope of Stochastics D then became positive. We can also observe that the slopes of both Stochastics K and Stochastics D remain positive, suggesting continued price appreciation.
Stay on top of the cryptocurrency market with CryptoDaily’s trading charts!