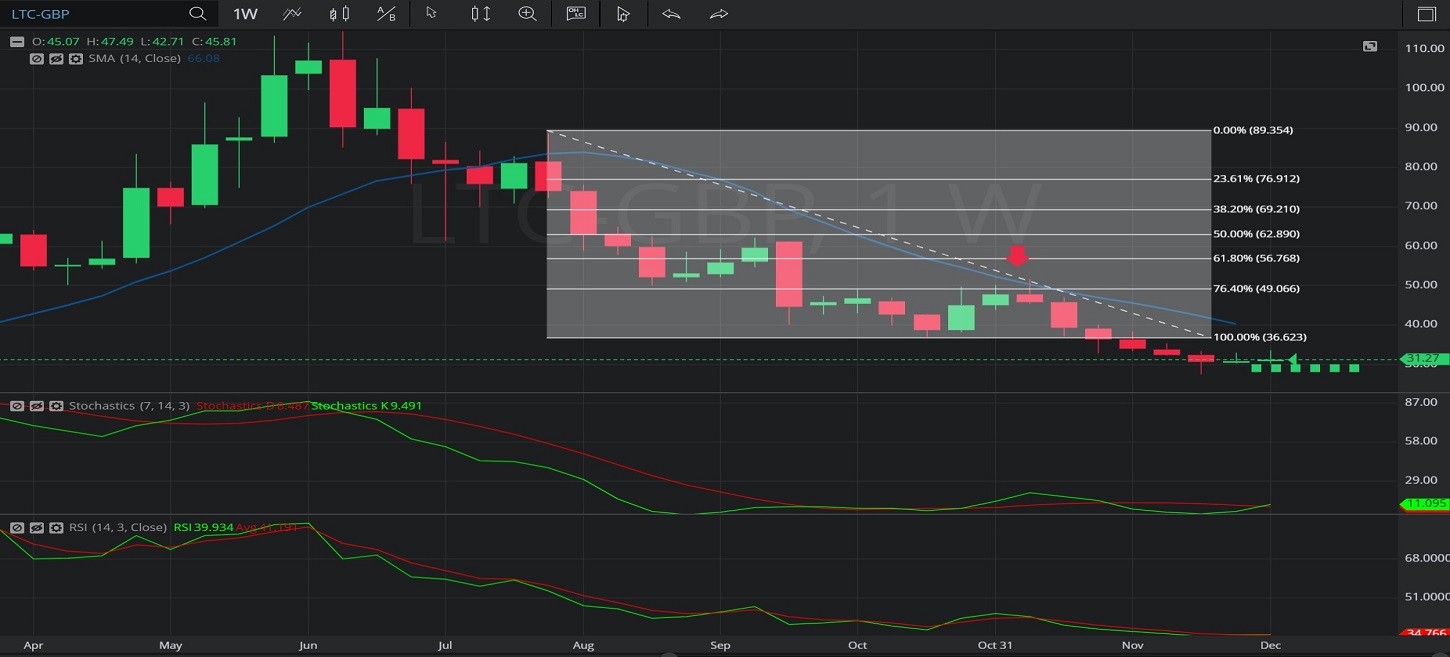
In this Weekly chart of Litecoin/ British pound (LTC/ GBP), there is a depreciating range from 88.67 to 37.05.
We can observe that the market then appreciated to the 51.90 level (identified by the red down arrow), above the 49.23 area that represents the 23.6% retracement of the depreciating range.
This 51.90 level was also above the 14-bar Simple Moving Average, which was indicating around the 50.19 area. The market had been trading below the 14-bar Simple Moving Average since July 2019.
We can observe that the market then depreciated to the 27.63 level.
Using RSI, we can observe that the slopes of both RSI (14) and RSI Average (3) turned negative after the market traded as high as 51.90. RSI Average (3) continues to indicate above RSI (14) but the slope of RSI (14) has turned positive, suggesting the depreciation may be ending.
Using Slow Stochastics, we can observe that the slope of Stochastics K turned negative after the market traded as high as 51.90, and thereafter Stochastics D bearishly moved above Stochastics K. We can also observe that Stochastics K has moved back above Stochastics D, suggesting price depreciation may have ended.
Stay on top of the cryptocurrency market with CryptoDaily’s trading charts!