26 January 2020 - BAT/ USDC – 4-hourly
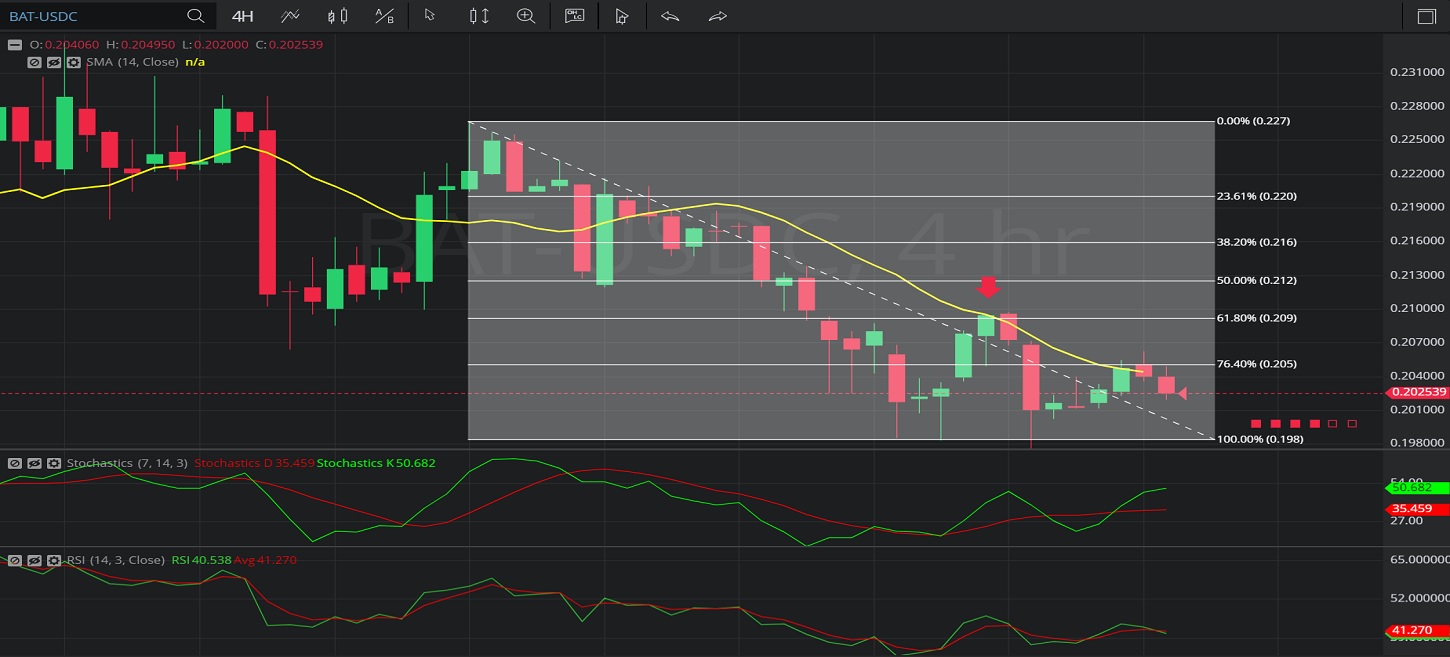
In this 4-hourly chart of Basic Attention Token / United States dollar Coin (BAT/ USDC), there is a depreciating range from 0.226694 to 0.198400.
We can observe that the market then appreciated to the 0.209808 level (identified by the red down arrow), right around the 0.209208 level that represents the 38.2% retracement of the depreciating range.
We can observe that this was also very close to the 14-bar Simple Moving Average.
We can observe that the market then depreciated to the 0.197594 before appreciating to the 0.206332 level and then depreciating again to the 0.202 level.
Using RSI, we can observe that the slope of RSI (14) and the slope of RSI Average (3) turned negative after the market traded as high as 0.209808. We can also observe that RSI Average (3) bearishly moved above RSI (14), and that RSI Average (3) has again moved above RSI (14), suggesting price depreciation may continue.
Using Slow Stochastics, we can observe that the slope of Stochastics K turned negative after the market traded as high as 0.209808, and that Stochastics D bearishly moved above Stochastics K.
Stay on top of the cryptocurrency market with CryptoDaily’s trading charts!
