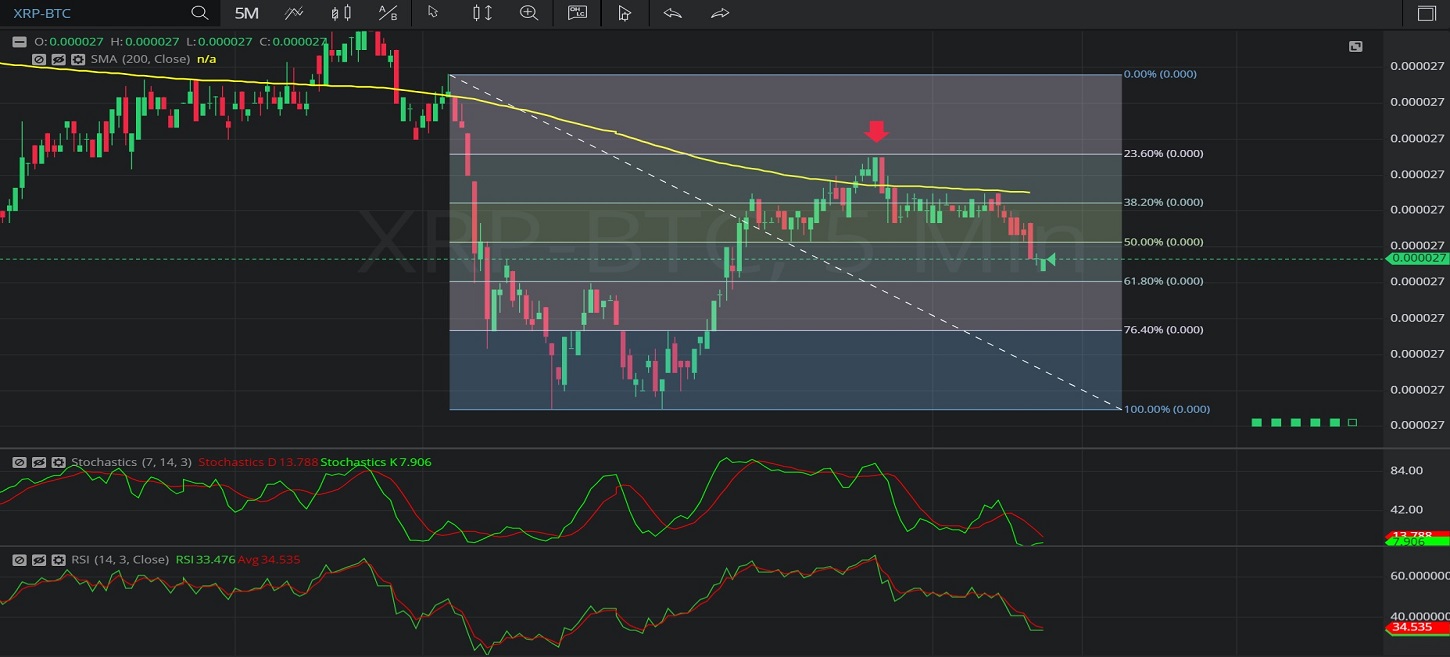
In this 5-minute chart of Ripple / Bitcoin (XRP/ BTC), there is a depreciating range from 0.00002711 to 0.00002655.
We can observe that the market then appreciated to the 0.00002697 level (identified by the red down arrow), right around the 0.00002697 level that represents the 76.4% retracement of the depreciating range.
We can observe that the market then depreciated to the 0.00002677 level after encountering technical resistance and selling pressure around the 200-bar Simple Moving Average.
Using RSI, we can observe that the slope of RSI (14) and the slope of RSI Average (3) turned negative after the market traded as high as 0.00002697. We can also observe that RSI Average (3) bearishly moved above RSI (14), and that RSI Average (3) remains above RSI (14), suggesting price depreciation may continue.
Using Slow Stochastics, we can observe that the slope of Stochastics K and the slope of Stochastics D turned negative after the market traded as high as 0.00002697, and that Stochastics D bearishly moved above Stochastics K. We can also observe that Stochastics D remains above Stochastics K, suggesting price depreciation may continue.
Stay on top of the cryptocurrency market with CryptoDaily’s trading charts!