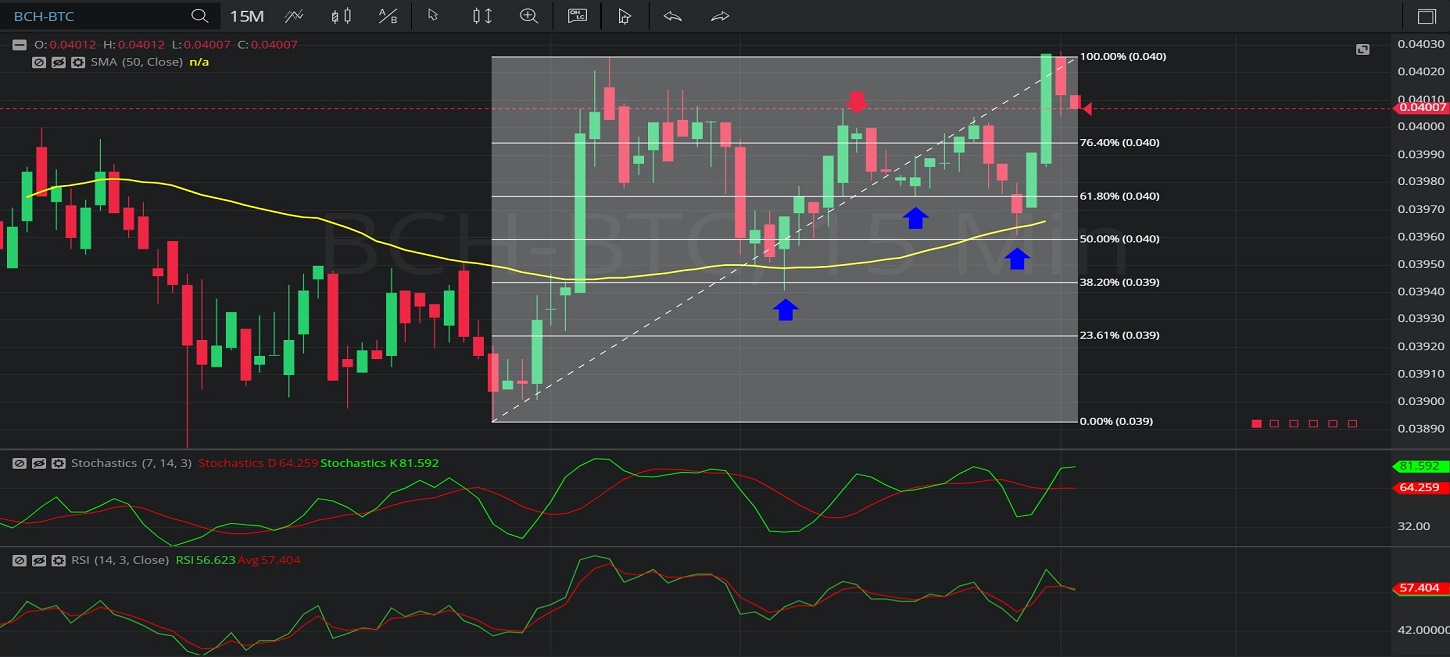
In this 15-minute chart of Bitcoin Cash / Bitcoin (BCH/ BTC), there is an appreciating range from 0.03893 to 0.04026.
We can observe that the market then depreciated to the 0.03941 level (identified by the first blue up arrow), just below the 0.03943806 area that represents the 61.8% retracement of the appreciating range.
We can observe that this level was a little bit below the 50-bar Simple Moving Average.
We can observe that the market then appreciated to the 0.04007 level (identified by the red down arrow), above the 0.03994612 level that represents the 23.6% retracement of the appreciating range.
We can observe that the market then depreciated to the 0.03975 level (identified by the second blue up arrow), right around the 0.03975194 area that represents the 38.2% retracement of the appreciating range.
We can observe the market then recovered and then depreciated further to the 0.03961 level (identified by the third blue up arrow), just above the 0.039595 area that represents the 50% retracement of the appreciating range.
We can observe that this level was also just below the 50-bar Simple Moving Average.
We can observe that the market then appreciated to the 0.04028 level.
Using RSI, we can observe that the slope of RSI (14) and the slope of RSI Average (3) turned positive after the market traded as low as 0.03941, 0.03975, and 0.03961 levels. We can also observe that RSI (14) bullishly crossed above RSI Average (3) after the market traded around those levels.
Using Slow Stochastics, we can observe that the slope of Stochastics K and the slope of Stochastics D turned positive after the market traded as low as the 0.03941, 0.03975, and 0.03961 levels. We can observe that Stochastics K bullishly crossed above Stochastics D after the market traded around those levels.
Stay on top of the cryptocurrency market with CryptoDaily’s trading charts!