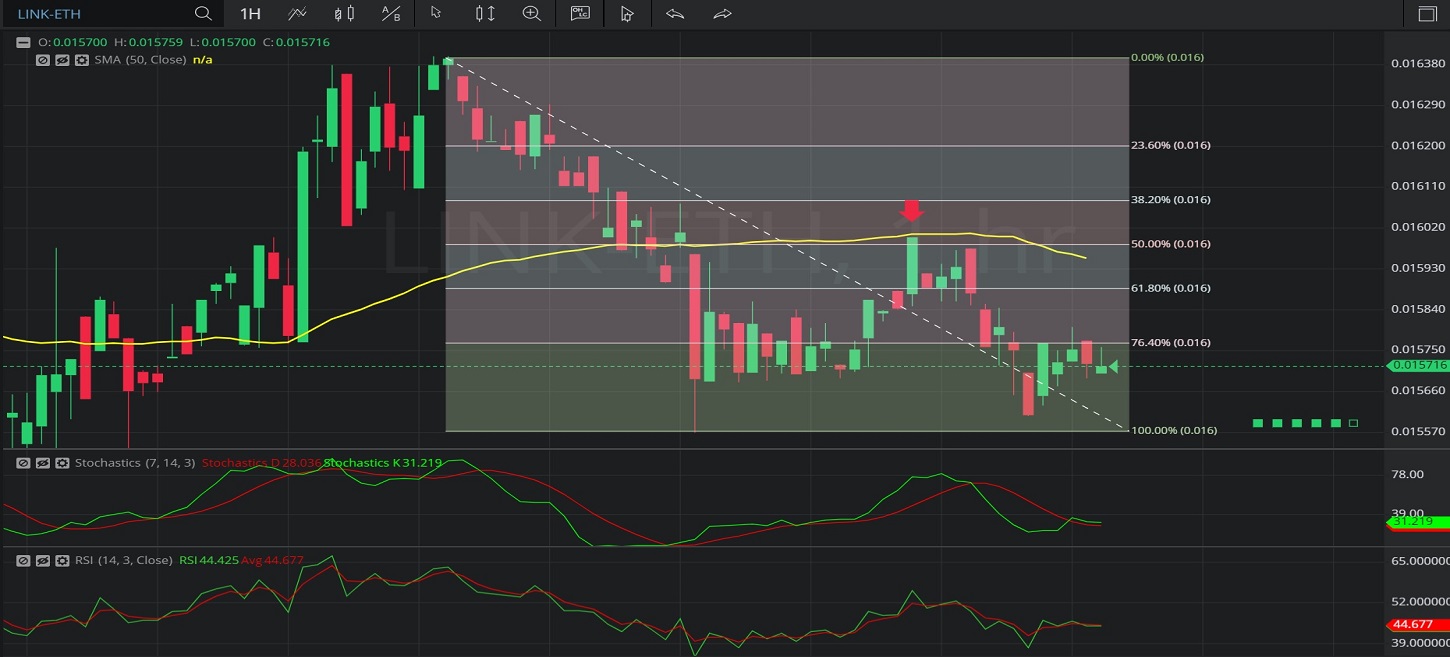
In this Hourly chart of Chainlink / Ethereum (LINK/ ETH), there is a depreciating range from 0.0164 to 0.015569.
We can observe that the market then appreciated to the 0.016 level (identified by the red down arrow), just above the 0.0159845 area, right around the 50% retracement of the depreciating range.
These levels were also close to the 50-bar Simple Moving Average (identified in yellow), indicating around the 0.016005 area.
We can observe that the market then depreciated as low as the 0.015608 area before appreciating to the 0.015802 level.
Using RSI, we can observe that the slope of RSI (14) and the slope of RSI Average (3) turned negative after the market peaked around the 0.016. We can also observe that RSI Average (3) bearishly crossed above RSI (14) after the market traded as high as 0.016 and that RSI (14) crossed above RSI Average (3) after the market traded as low as the 0.015608.
Using Slow Stochastics, we can observe that the slope of Stochastics K turned negative after the market traded as high as 0.016, and that Stochastics D bearishly crossed above Stochastics K. The slope of Stochastics D then turned negative. We can also observe that the slope of Stochastics K turned positive after the market traded as low as 0.015608, and that Stochastics K then bullishly moved above Stochastics D.
Stay on top of the cryptocurrency market with CryptoDaily’s trading charts!