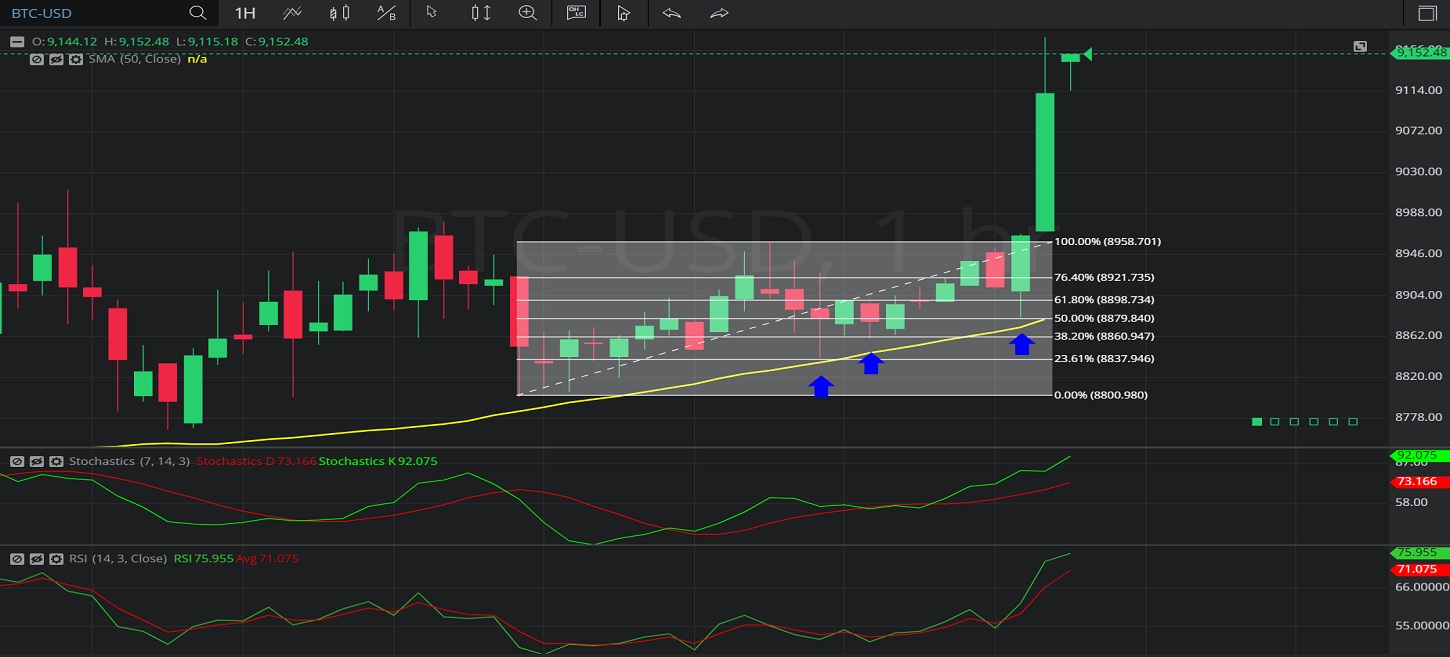
In this Hourly chart of Bitcoin / US dollar (BTC/ USD), there is an appreciating range from 8800.10 to 8958.82.
We can observe that the market then depreciated to the 8840.00 level (identified by the blue up arrow), just above the 8837.56 level that represents the 76.4% retracement of the appreciating range.
These levels were also close to the 50-bar Simple Moving Average (identified in yellow), indicating around the 8835.05 level.
We can observe that the market then appreciated and was supported around the 8860.49 area (identified by the second blue up arrow), right around the 8860.73 level that represents the 61.8% retracement of the appreciating range.
We can observe that the market then appreciated and was supported around the 8882.00 level (identified by the third blue up arrow), just above the 8879.46 area that represents the 50% retracement of the appreciating range.
We can observe that the market then appreciated to the 9178.13 level.
Using RSI, we can observe that the slope of RSI (14) and the slope of RSI Average (3) turned positive after the market found support around the 8860.49 level. We can see that RSI (14) bullishly moved back above RSI Average (3) after the market found support around the 8882.00 level. RSI (14) continues to indicate above RSI Average (3), indicating additional price appreciation is likely.
Using Slow Stochastics, we can observe that the slope of Stochastics K and the slope of Stochastics D turned positive after the market found support around the 8860.49 area, and that Stochastics K bullishly crossed above Stochastics D. We can also observe that Stochastics K is bullishly diverging from Stochastics D, indicating additional price appreciation is likely.
Stay on top of the cryptocurrency market with CryptoDaily’s trading charts!