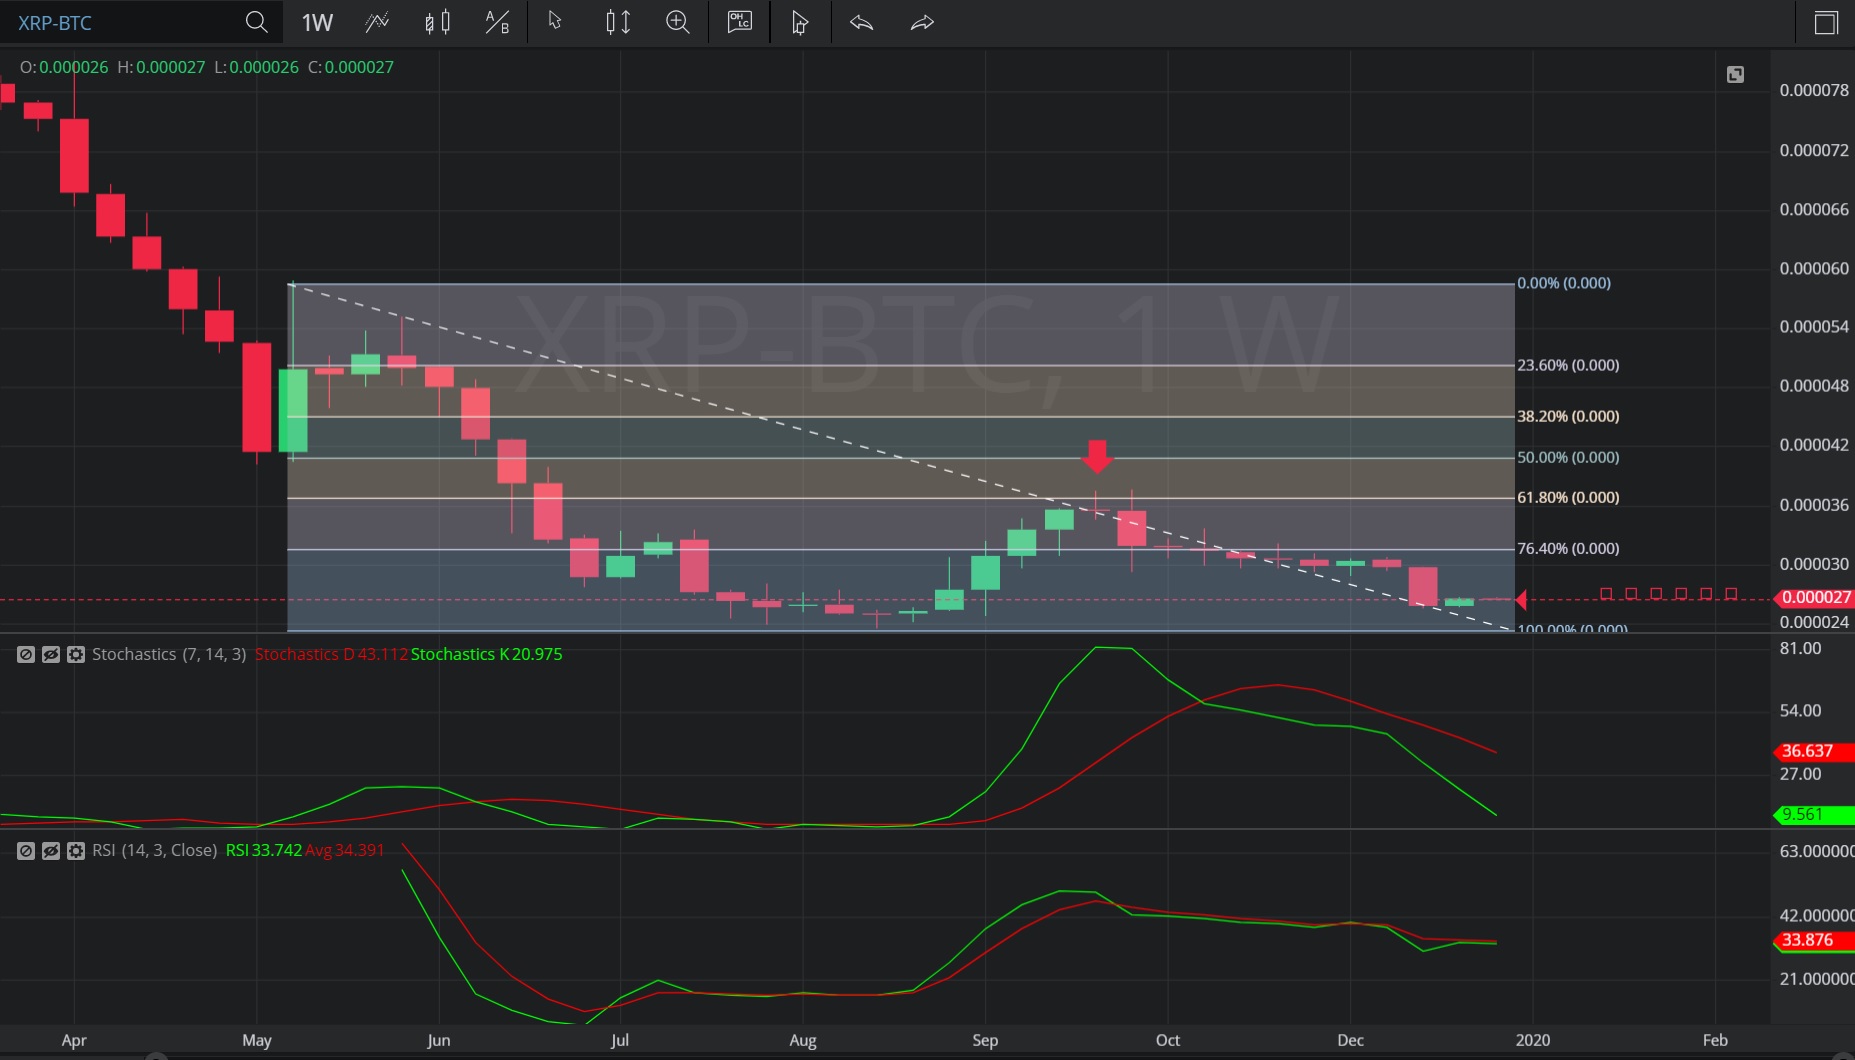
In this Weekly chart of XRP/ Bitcoin (XRP/ BTC), there is a depreciating range from 0.000059 to 0.00002362.
We can observe that the market then appreciated to the 0.00003774 level (identified by the red down arrow), just above the 0.00003713 area that represents the 38.2% retracement of the appreciating range.
We can observe that the market then depreciated and continues to depreciate.
Using RSI, we can observe that the slopes of both RSI (14) and RSI Average (3) bearishly turned negative after the market traded as high as 0.00003774. We can also observe that RSI Average (3) also bearishly moved above RSI (14) thereafter, suggesting price depreciation. The slopes of both RSI (14) and RSI Average (3) remain negative and RSI Average (3) remains above RSI (14), suggesting there may be a continuation in price depreciation.
Using Slow Stochastics, we can observe that Stochastics D bearishly moved above Stochastics K after the market traded as high as 0.00003774. We can observe that the slope of Stochastics D then turned negative and that the slopes of both Stochastics D and Stochastics K remain negative and are diverging, suggesting there may be a continuation in price depreciation.
Stay on top of the cryptocurrency market with CryptoDaily’s trading charts!