18 January 2020 - LTC/ EUR – Weekly
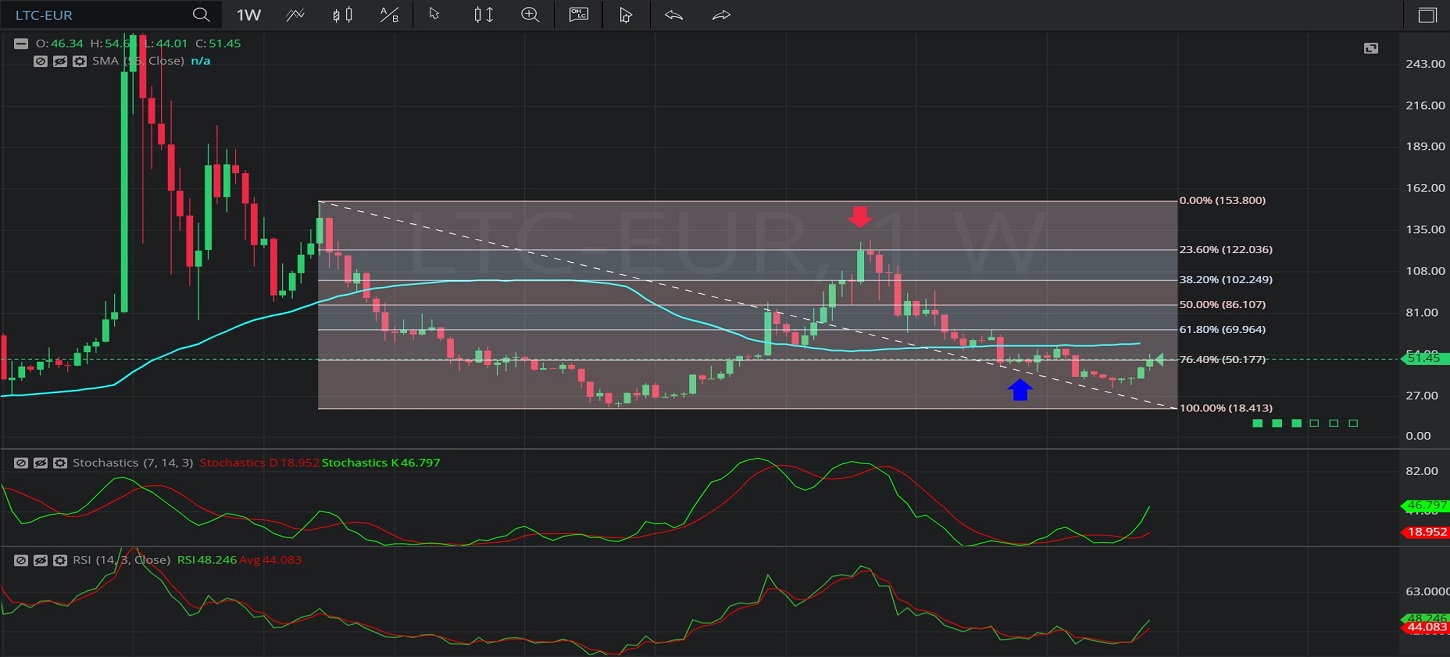
In this Weekly chart of Litecoin / Euro (LTC/EUR), there is a depreciating range from 153.20 to 19.75.
We can observe that the market then appreciated to the 128.59 level, above the 121.71 level that represents the 76.4% retracement of the depreciating range.
We can observe that the market then depreciated to the 42.63 area, below the 51.24 level that represents the 23.6% retracement of the depreciating range.
We can also observe that the 55-bar Simple Moving Average was indicating between the 23.6% and 38.2% retracement levels of the depreciating range when the market traded as low as the 42.63 level.
We can observe that the market then depreciated further to the 32.44 level before appreciating.
Using RSI, we can observe that the slope of RSI (14) and the slope of RSI Average (3) turned negative after the market traded as high as the 128.59 level, and that RSI Average (3) bearishly moved above RSI (14). RSI (14) moved above RSI Average (3) when the market traded as low as the 32.44 level.
Using Slow Stochastics, we can observe that the slope of Stochastics K turned negative after the market tested the 76.4% retracement of the depreciating range. Stochastics D then bearishly crossed above Stochastics K, and the slope of Stochastics D turned negative. We can observe that Stochastics K moved above Stochastics D after the market traded as low as the 42.63 low before Stochastics D moved back above Stochastics K.
Stay on top of the cryptocurrency market with CryptoDaily’s trading charts!
