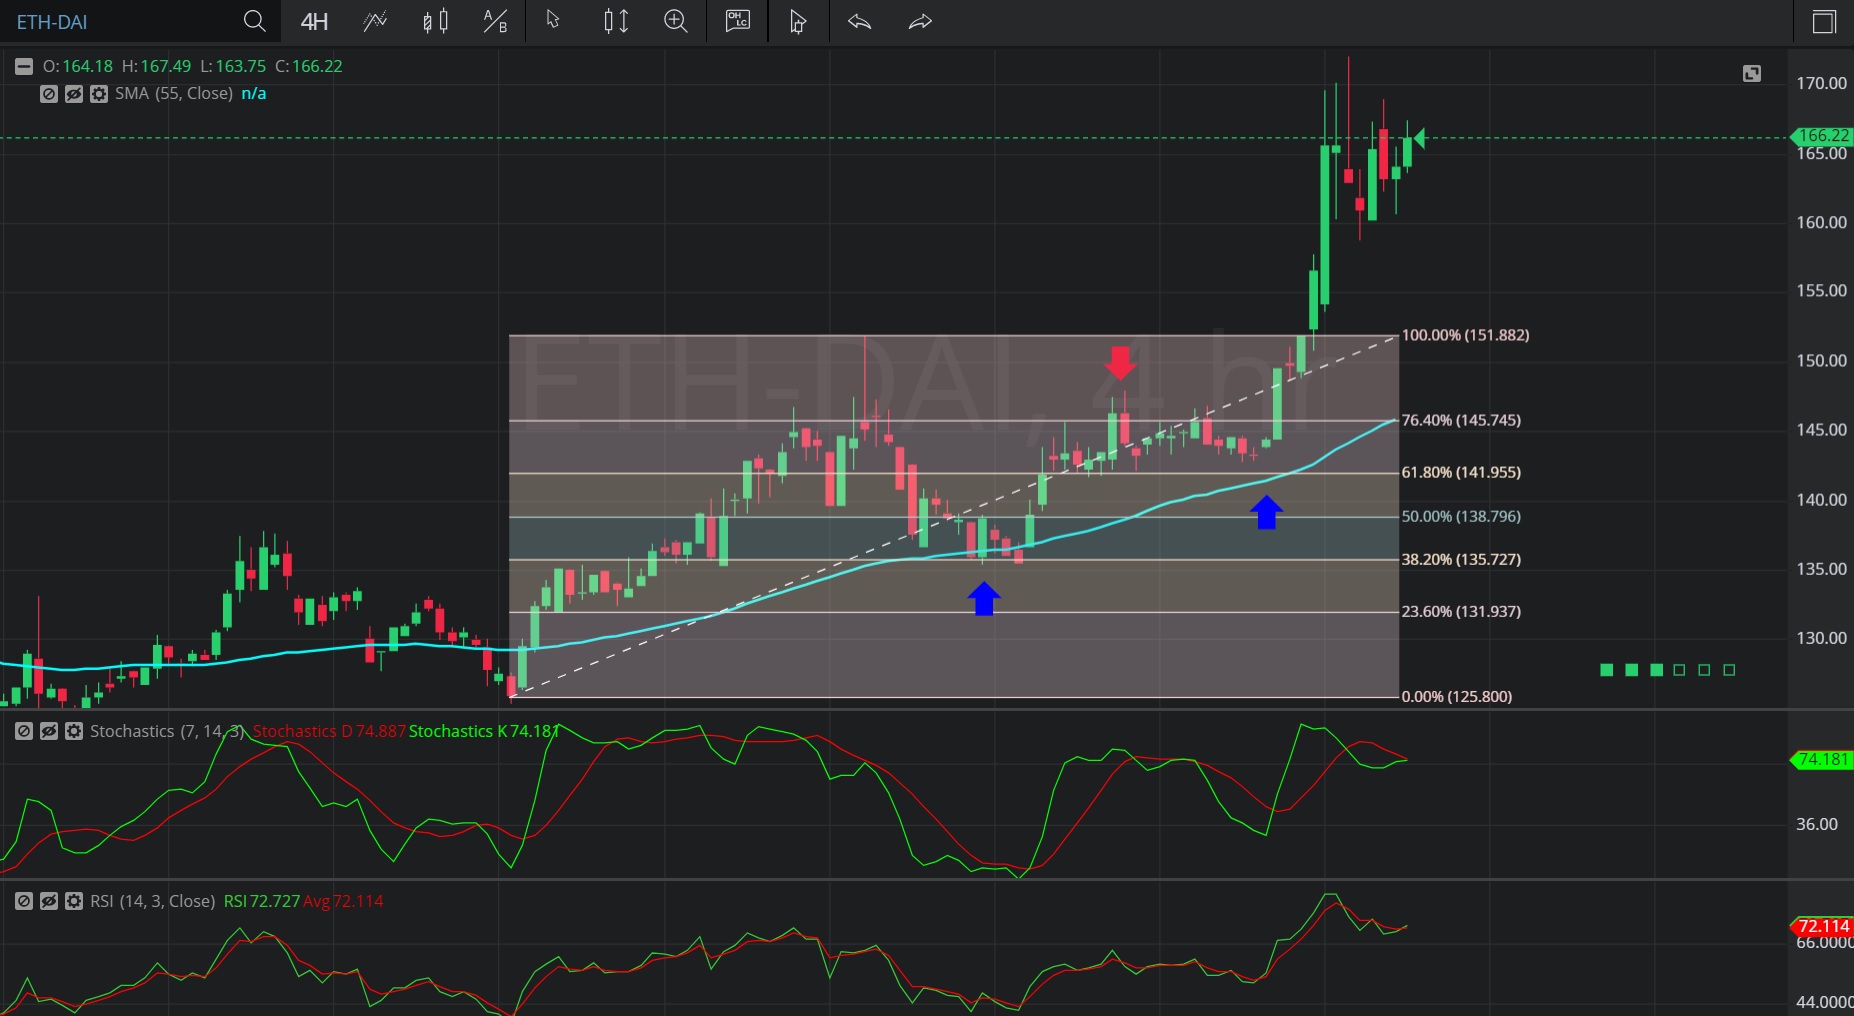
In this 4-hourly chart of Ethereum / Single Collateral DAI (ETH/ DAI), there is an appreciating range from 125.43 to 151.97.
We can observe that the market then depreciated to the 135.48 level (identified by the first blue up arrow), just below the 135.56 level that represents the 61.8% retracement of the appreciating range.
Notably, the 55-bar Simple Moving Average was indicating around the 136.37 level when the market depreciated.
We can observe that the market then appreciated to the 147.98 area (identified by the red down arrow), above the 145.71 area that represents the 23.6% retracement of the appreciating range.
We can observe that the market then moved back towards the 142.84 level, above the 141.83 level that represents the 38.2% retracement of the appreciating range (identified by the second blue up arrow).
We can observe that the market then appreciated to the 172.09 level.
Using RSI, we can observe that the slope of RSI (14) and the slope of RSI Average (3) turned positive after the market tested the 61.8% retracement of the appreciating range, and that RSI (14) bullishly moved above RSI Average (3). We observe that RSI Average (3) then moved above RSI (14), but then RSI (14) moved back above RSI Average (3) (identified by the second blue up arrow). The market continues to appreciate.
Using Slow Stochastics, we can observe that the slope of Stochastics K and the slope of Stochastics D bullishly turned positive after the market tested the 61.8% retracement level of the appreciating range. We can also observe that Stochastics K then bullishly crossed above Stochastics D. Even though Stochastics D moved back above Stochastics K, we can see that Stochastics K again moved back above Stochastics D when the market started to appreciate (identified by the second blue up arrow).
Stay on top of the cryptocurrency market with CryptoDaily’s trading charts!