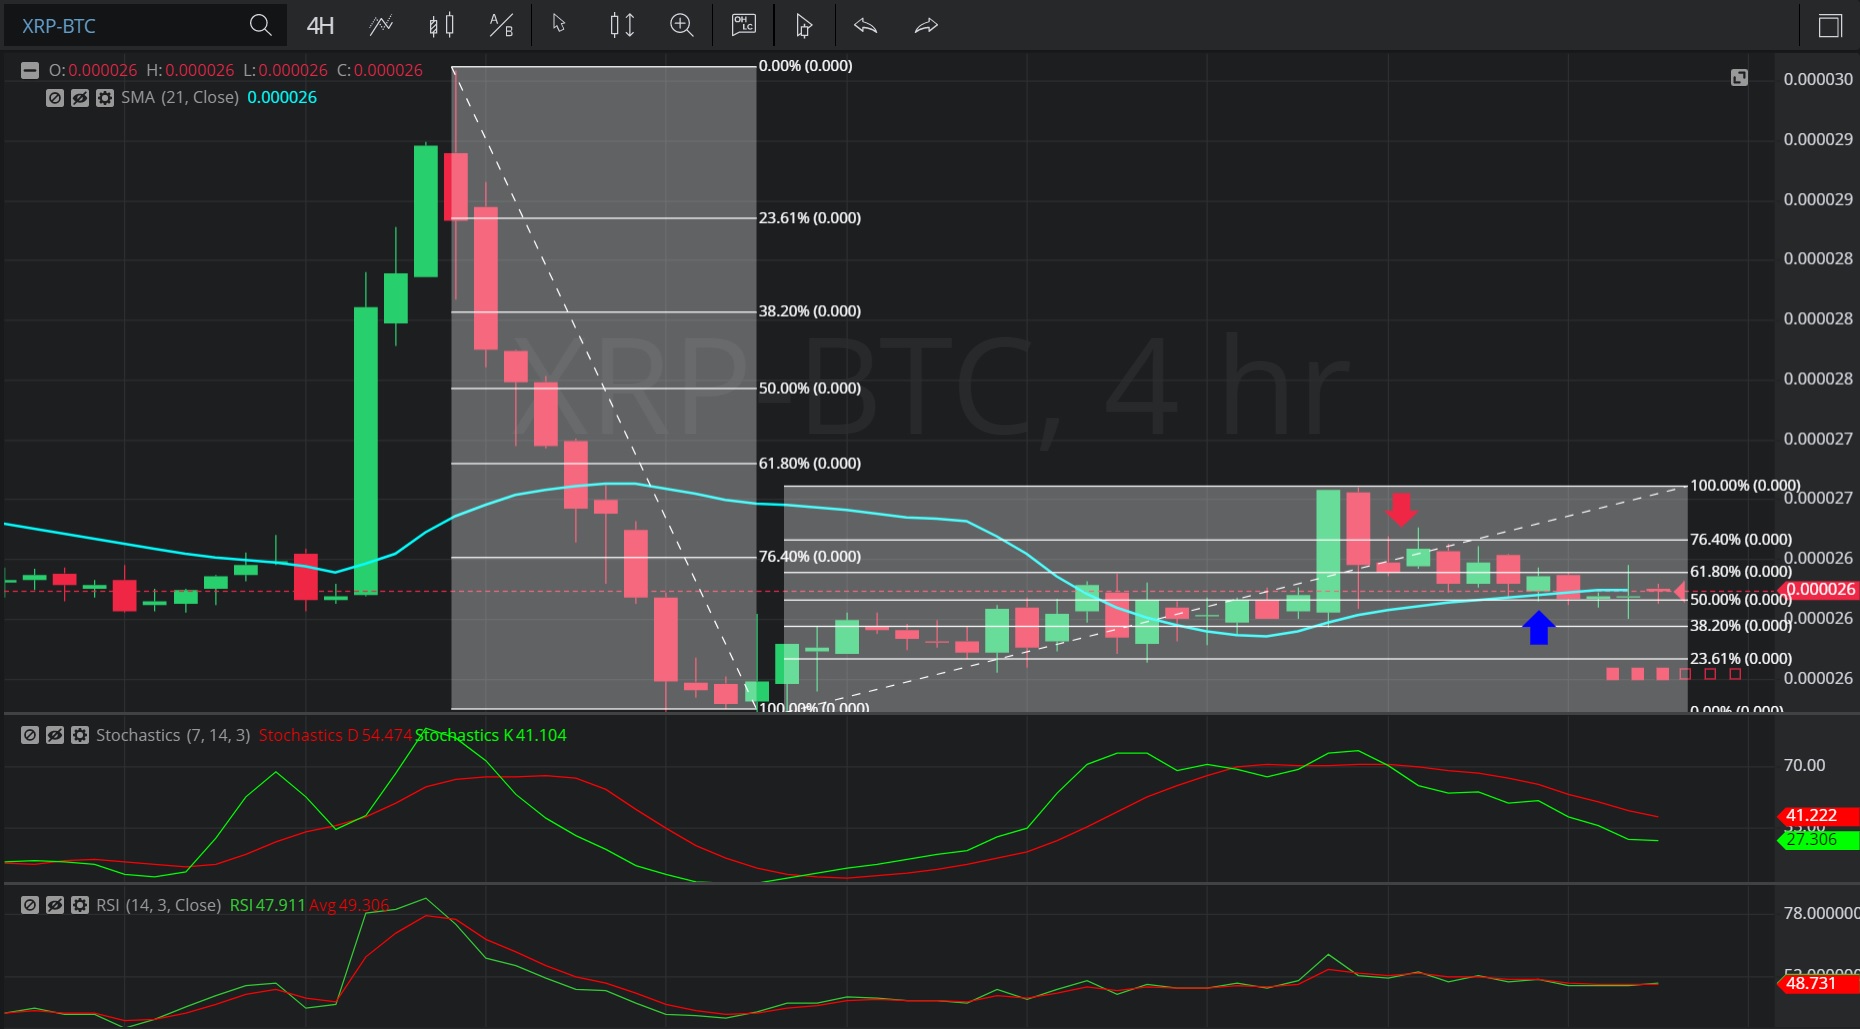
In this 4-hourly chart of Ripple/ Bitcoin (XRP/ BTC), there is an appreciating range from 0.00002536 to 0.00002689 after a much larger depreciating range from 0.00002968 to 0.00002536.
We can observe that the market then depreciated to the 0.00002607 level before appreciating to the 0.00002662 level (identified by the red down arrow), just above the 0.00002652 area that represents the 23.6% retracement of the appreciating range.
We can see that the market then depreciated to the 0.00002601 level (identified by the blue up arrow), right around the 0.00002612 level that represents the 50% of the appreciating range.
This is also right around the level where the 21-bar Simple Moving Average was trading at the time.
Using RSI, we can observe that the slope of RSI (14) and the slope of RSI Average (3) turned negative after the market appreciated to and then retraced away from the 0.00002662 level. We can also observe that the slope of RSI (14) and RSI Average (3) continue to be negative, indicating additional price depreciation is likely.
Using Slow Stochastics, we can observe that the slope of Stochastics K and the slope of Stochastics D bearishly turned negative after the market appreciated to and then retraced away from the 0.00002662 level. We can also observe that Stochastics D bearishly crossed above Stochastics K, and that Stochastics D continues to indicate above Stochastics K, suggesting additional price depreciation is likely.
Stay on top of the cryptocurrency market with CryptoDaily’s trading charts!