10 January 2020 - EOS/ BTC – Hourly
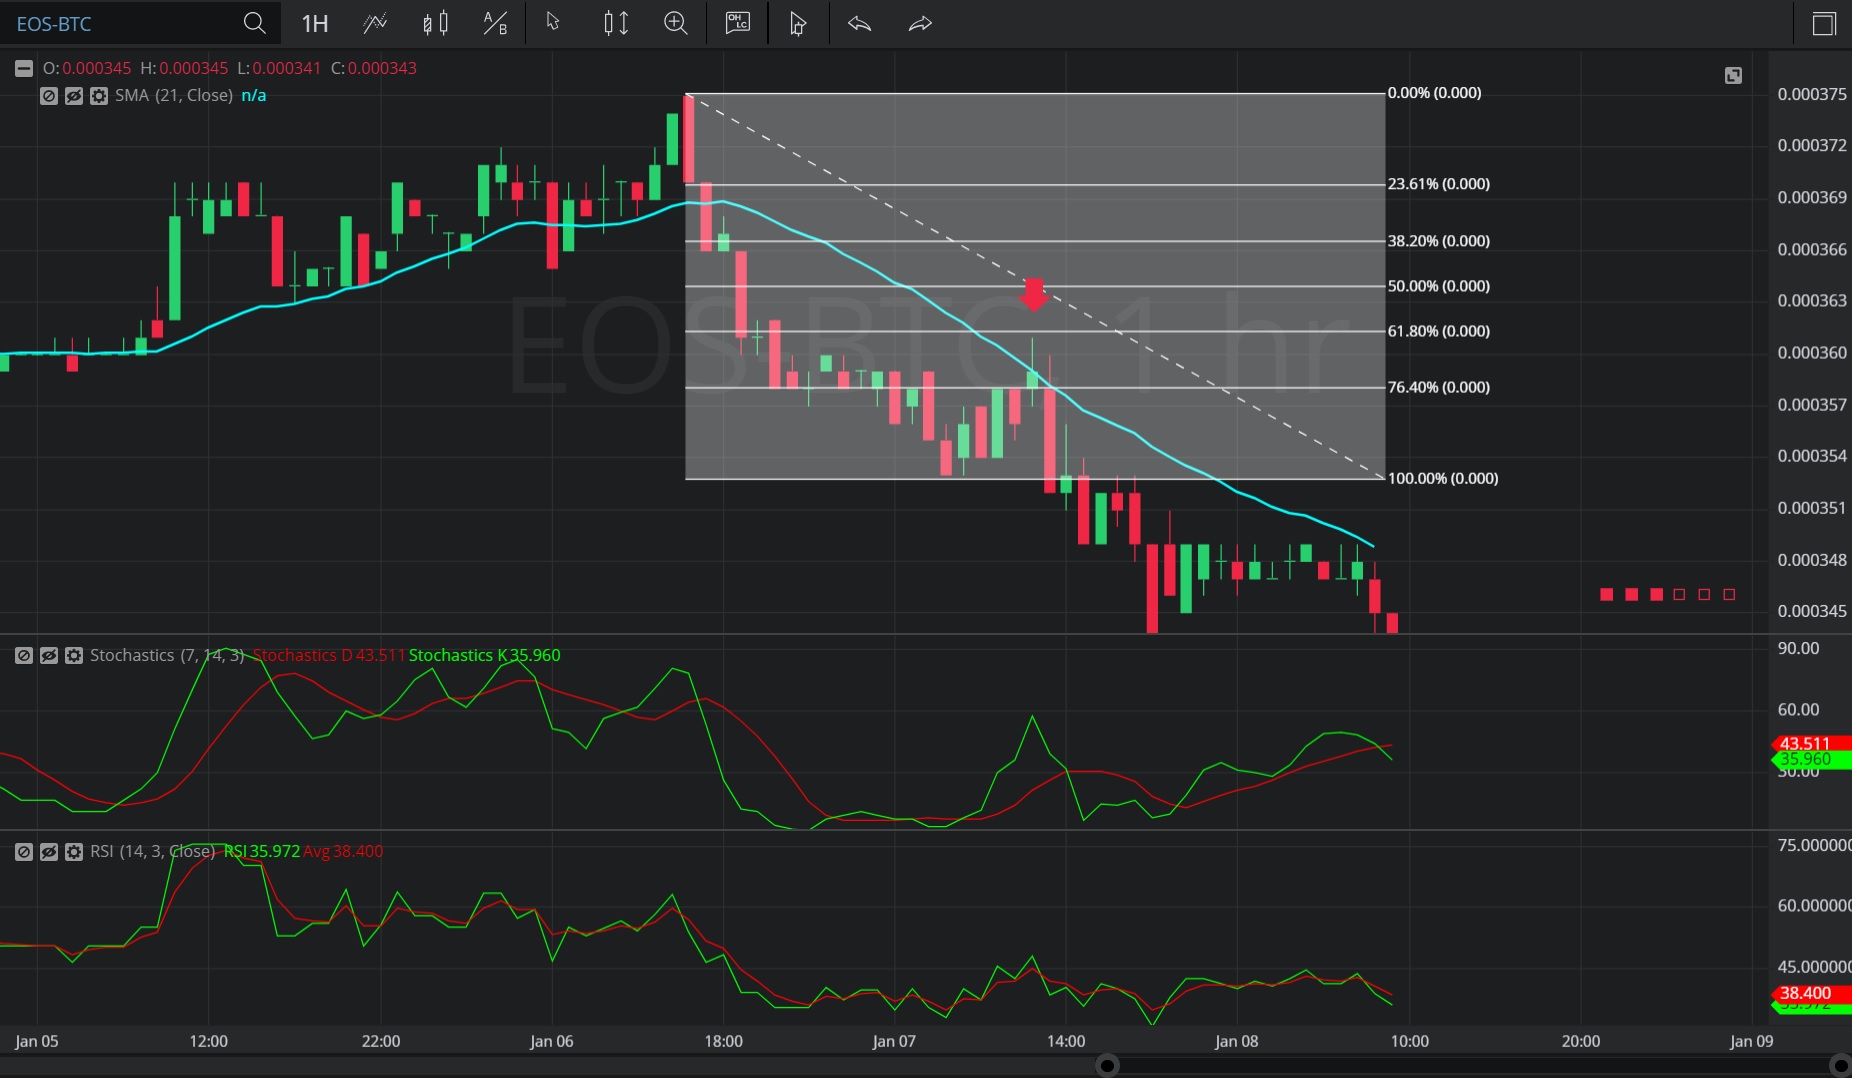
In this Hourly chart of EOS/ Bitcoin (EOS/ BTC), there is a depreciating range from 0.000375 to 0.000353.
We can observe that the market then appreciated to the 0.000361 level (identified by the red down arrow), just below the 0.00036140 level that represents the 38.2% retracement of the depreciating range.
We can observe that the 0.000361 level was just above the 0.000359 level, the area where the 21-bar Simple Moving Average was indicating at the time.
The market then depreciated to the 0.000341 level.
Using RSI, we can observe that the slope of RSI (14) turned negative after the market traded as high as the 0.000361 level, and that RSI Average (3) bearishly crossed above RSI (14) thereafter. Even though RSI (14) and RSI Average (3) have since crossed many times, RSI Average (3) is currently indicating above RSI (14). The slopes of both RSI (14) and RSI Average (3) are negative and this is bearish.
Using Slow Stochastics, we can observe that the slope of Stochastics K bearishly turned negative after the market traded as high as the 0.000361 level. Stochastics K then bearishly moved below Stochastics D, indicating price depreciation. Even though Stochastics K then moved above Stochastics D, Stochastics K has moved back below Stochastics D, indicating additional price depreciation. The slope of Stochastics K is negative and this is bearish.
Stay on top of the cryptocurrency market with CryptoDaily’s trading charts!
