Bitcoin (BTC) Dominance Breakout Points To Unprecedented Market Crash
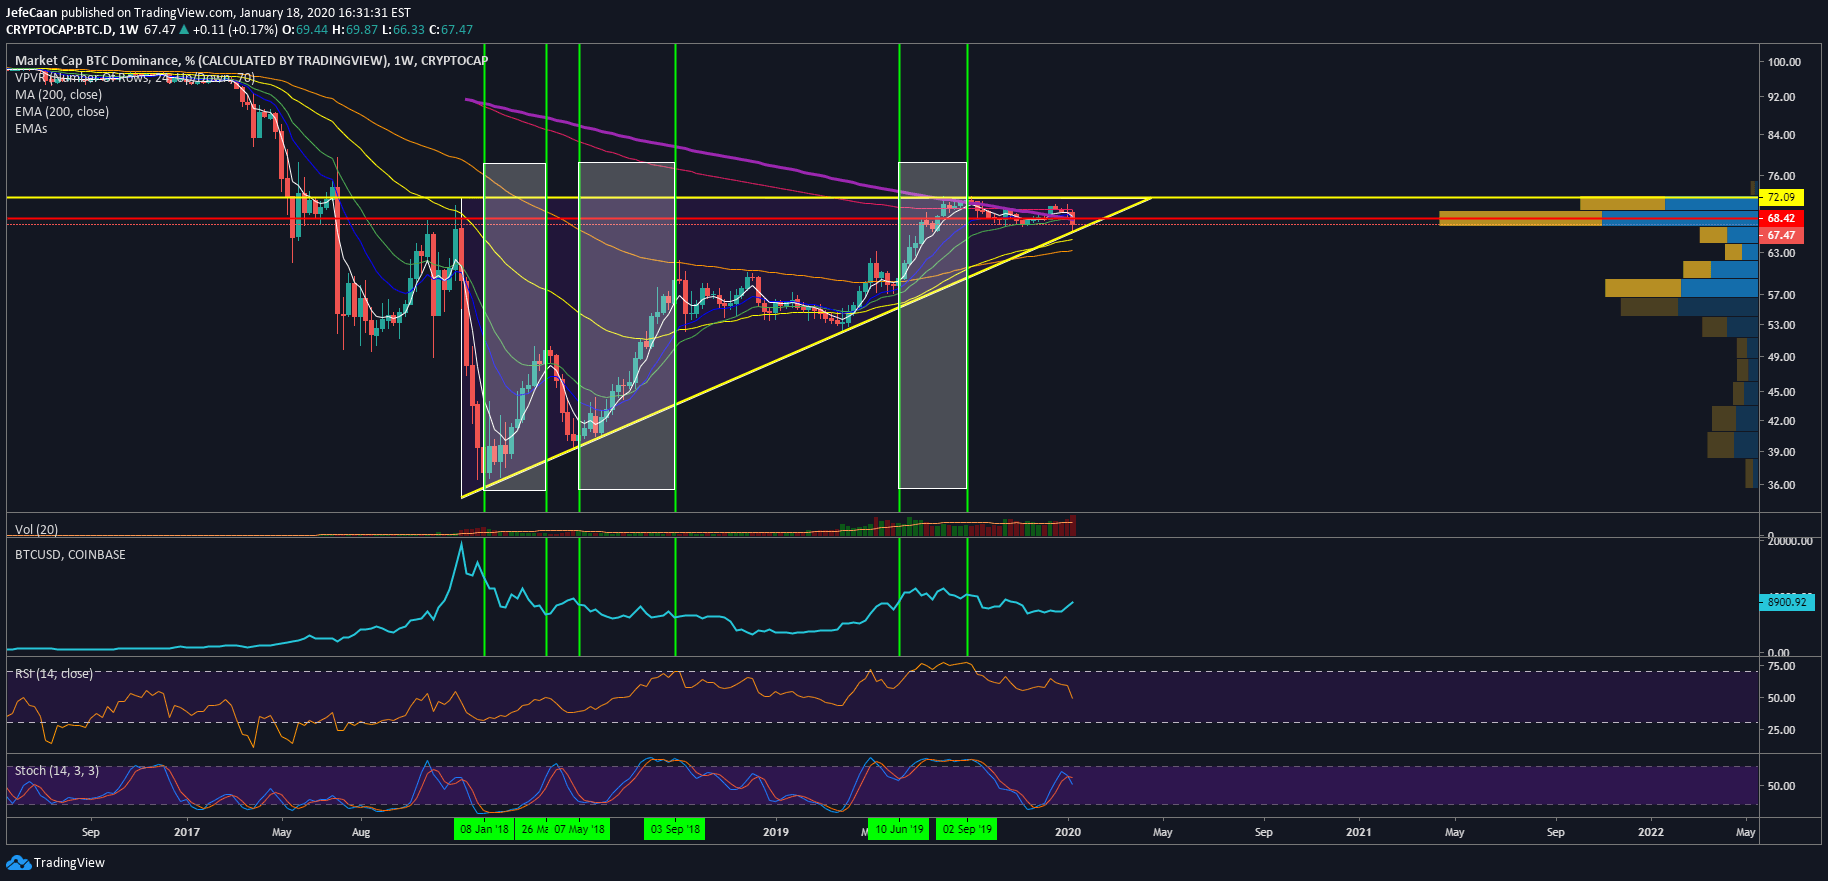
A rising Bitcoin dominance (BTC.D) has always been bearish for the market on a larger time frame. This is because a rising Bitcoin dominance means one of two things. Either Bitcoin is rising and the rest of the market is lagging behind or the cryptocurrency market is falling with Bitcoin holding its ground better compared to other coins. We have seen both happen in the past but we have also seen that the former scenario is short-lived most of the time and there is no larger trend. The three segments on the weekly chart for Bitcoin dominance (BTC.D) shows how during each of these periods of a large uptrend in Bitcoin dominance (BTC.D), we have seen a decline in the price of Bitcoin (BTC).

The first segment starts from Jan 08, 2018 to Mar 26, 2018. The second segment starts from May 07, 2018 to Sep 03, 2018 and the third second starts from June 10, 2019 to Sep 02, 2019. We can see on the chart that Bitcoin dominance is about to shoot past the ascending triangle. This will be the most important development for Bitcoin since December, 2017. It will have a major impact on the direction this market takes from here on out. If Bitcoin dominance (BTC.D) shoots past the 72% resistance and rises further, that would be it for the altcoin market. It would be the beginning of something unprecedented. December, 2016 to December, 2017 was the most bullish period for the cryptocurrency market and we saw Bitcoin dominance (BTC.D) crash hard during that period. Now that it is about to revert back to mean, traders ought to be extremely careful being bullish.
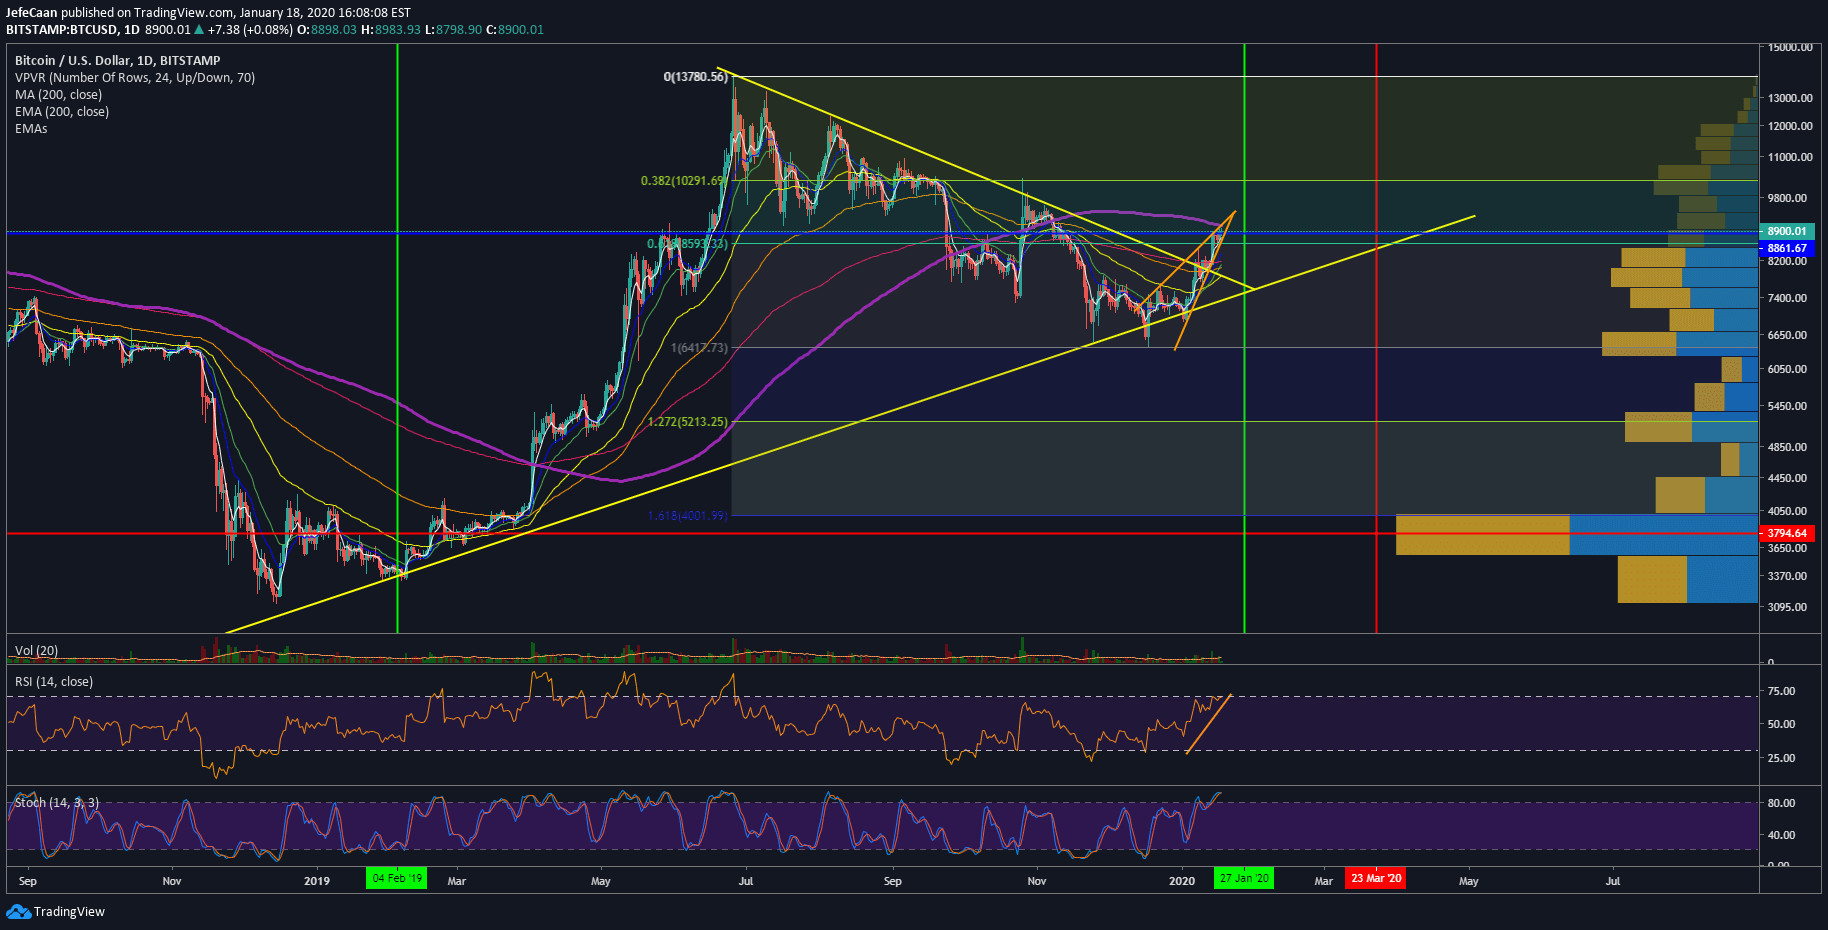
The Chinese New Year is just around the corner which could be a point where we might see a new trend begin. At the moment, the price is struggling to break past the 200-day moving average. It is unlikely to have a successful breakout past that and is expected to eventually decline down to the trend line support. This trend line support is what stands between BTC/USD and the next major crash.
We can see on the daily chart for BTC/USD that the price remains below the 200-day moving average. It has had quite a bull run above the 200-day moving average but it has only been below it for six months. It is very unlikely for this bear trend to be broken so soon considering Bitcoin dominance (BTC.D) is ready to begin a new uptrend and market conditions for the S&P 500 (SPX), the EUR/USD forex pair as well as the bond market spell trouble for Bitcoin (BTC) and other cryptocurrencies. The next halving has gotten a lot of traders very excited once again but it could prove to be a major bull trap considering optimism is at an all-time high and the majority of retail traders are on the same side.