Bitcoin
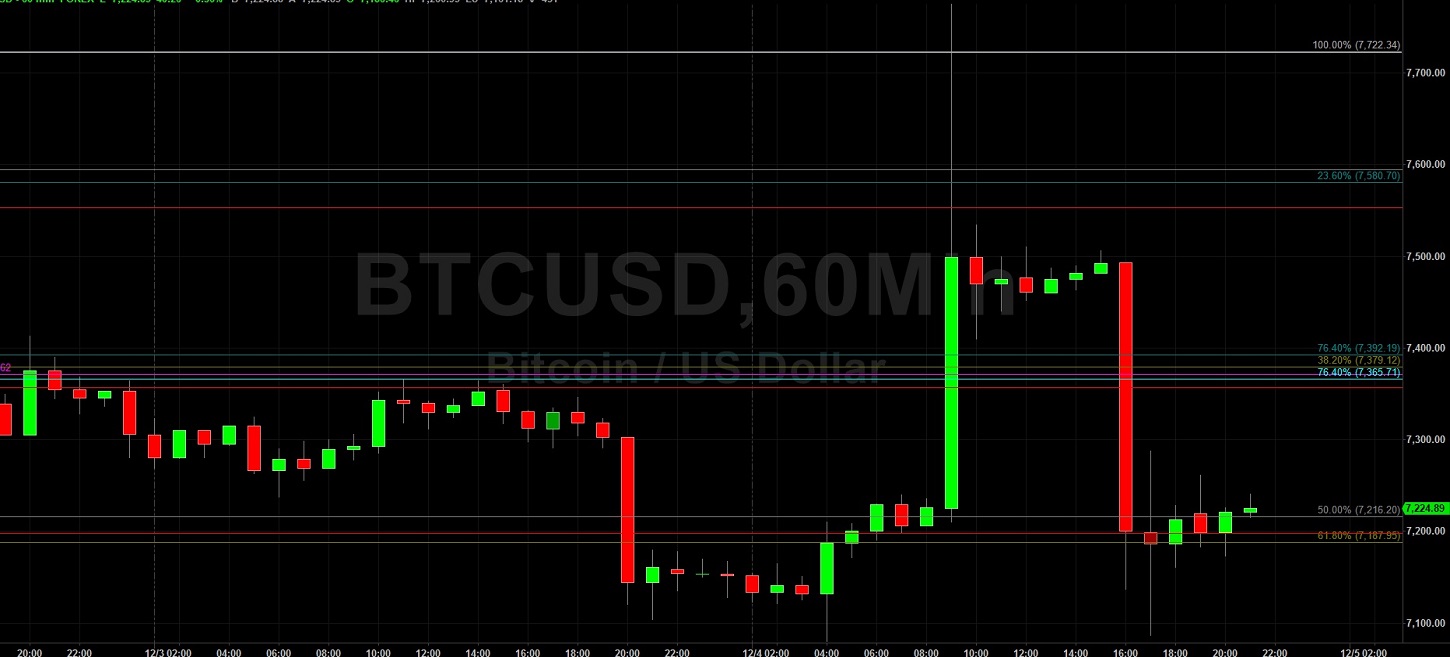
Bitcoin (BTC/USD) appreciated early in today’s Asian session as the pair traded as high as the 7287.75 level following its volatile and sharp ascent to the 7775.00 level early in yesterday’s North American session. Stops were elected above the 7552.89 area during the pair’s rapid climb, a level that represents the 23.6% retracement of the move from 6526.00 to 7870.10. The pair was unable to sustain its intraday gains yesterday and has largely now given back most of them. The pair’s short-term market bias appears like it will be determined by BTC Bulls around the 7198.05 area or by BTC Bears around the 7356.65 area. The 7198.05 area represents the 50% retracement of the recent 6526.00 – 7870.10 range and buying pressure has emerged around this level in recent trading sessions. The 7356.65 area represents the 38.2% retracement of the same recent range and selling pressure has emerged around this level in recent trading sessions.
If BTC Bulls are able to sustainably advance through the 7356.65 area, they may be able to challenge the 7552.89 area and then test an upside price objective target that remains in place around the 7906 area. If BTC Bears are able to punch below the 7198.05 area, they will have an opportunity to target the 7039.45 and 6843.21 areas on the downside with the possibility of testing recent lows around the 6256.00 area. BTC/USD has been pressured and Given in the market during the past several weeks, and traders are awaiting clues to adopt a fresh market bias and direction.
Price activity is nearest the 50-bar MA (4-hourly) at 7,402.32 and the 50-bar MA (Hourly) at 7,290.39.
Technical Support is expected around 6775.47/ 6653.57/ 6323.42 with Stops expected below.
Technical Resistance is expected around 7870.10/ 8062.04/ 8338.78 with Stops expected above.
On 4-Hourly chart, SlowK is Bearishly below SlowD while MACD is Bullishly above MACDAverage.
On 60-minute chart, SlowK is Bullishly above SlowD while MACD is Bearishly below MACDAverage.
Ethereum
Ethereum (ETH/USD) gained ground early in today’s Asian session as the pair traded as high as the 147.42 area following its spike to the 153.00 area during yesterday’s North American session. Stops were elected above the 151.17 level during the appreciation higher, an upside price extension objective, and also above the 151.61 area that represents the 23.6% retracement of the 131.80 – 157.73 range. Additional Stops were triggered above the 152.10 area, a level that represents a downside price extension objective related to the relative high of 199.50 from late October. Current market dynamics and recent trading activity have rendered it challenging to anticipate the pair’s next moves. The 144.77 area represents the 50% retracement of the recent 131.80 – 157.73 range and ETH Bulls have been buying the pair above this level following its recent peak. The 151.61 area represents the 23.6% retracement of the recent 131.80 – 157.73 range and ETH Bears have been selling the pair below this level following its recent peak.
If ETH Bulls are going to sustainably advance through the 151.61 area, they may be able to challenge the 160.15 and 161.39 areas that represent upside price objective targets. If ETH Bears are going to knock below the 144.77 area and challenge the 141.71 and 137.92 areas, they may have another opportunity to test buying pressure around the 132.90 area, representing the 23.6% retracement of the 302.20 – 80.60 range. Below this level, chartists eye the 127.07 area as a downside price objective target related to the recent 199.50 high, with some ETH/USD Bears seeing the 104 area as a very Bearish target.
Price activity is nearest the 50-bar MA (4-hourly) at 149.95 and the 50-bar MA (Hourly) at 147.24.
Technical Support is expected around 143.17/ 141.74/ 139.13 with Stops expected below.
Technical Resistance is expected around 153.00/ 155.50/ 160.15 with Stops expected above.
On 4-Hourly chart, SlowK is Bearishly below SlowD while MACD is Bearishly below MACDAverage.
On 60-minute chart, SlowK is Bearishly below SlowD while MACD is Bearishly below MACDAverage.