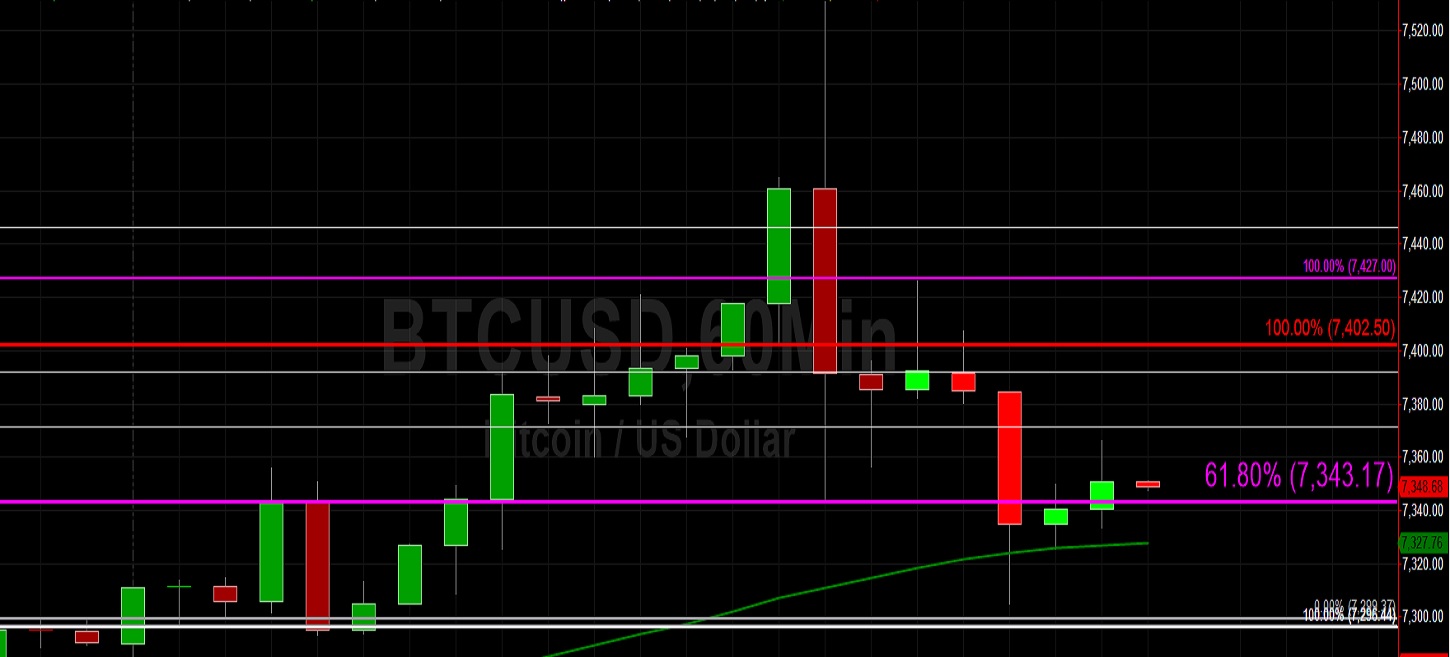
Bitcoin (BTC/USD) was a little stronger early in today’s Asian session as the pair gained ground to the 7366.00 area, having traded as high as the 7531.00 area during yesterday’s North American session. Traders wait to see how the pair will react around some important technical levels, including the 7343.17 area that traders tested during Saturday’s Asian session, representing the 61.8% retracement of the move from 9948.12 to 3128.89. Also, last week’s late-week surge to the 7432.10 level stopped just short of testing the 7446.16 area, representing the 61.8% retracement of the move from 7688.99 – 7053.32. Notably, the 50-bar MA (4-hourly) and 200-bar MA (4-hourly) have recently converged, and this is Bullish especially after the 50-bar MA (4-hourly) just moved above the 100-bar MA (4-hourly).
Similarly, the 50-bar MA (hourly), 100-bar MA (hourly), and 200-bar MA (hourly) have Bullishly converged and this may lead to a positive short-term shift in market sentiment. Another important level that BTC/USD Bulls are carefully watching is the 7059.50 area, representing the 50% retracement of the recent 6430.00 – 7688.99 range. BTC/USD tested this level a couple of days ago before moving higher, allowing some short-term traders to book some gains around the 7208 area. Given the upcoming year-end, traders are waiting to see if derivatives positions that may be rolling off soon could impact the pair.
Price activity is nearest the 50-bar MA (4-hourly) at 7,289.49 and the 50-bar MA (Hourly) at 7,327.81.
Technical Support is expected around 6526.00/ 6323.42/ 5941.26 with Stops expected below.
Technical Resistance is expected around 7870.10/ 7927.23/ 8338.78 with Stops expected above.
On 4-Hourly chart, SlowK is Bullishly above SlowD while MACD is Bearishly below MACDAverage.
On 60-minute chart, SlowK is Bullishly above SlowD while MACD is Bullishly above MACDAverage.
Ethereum (ETH/USD) appreciated early in today’s Asian session as the pair traded as high as the 128.36 level, following a move to the 137.85 area during yesterday’s North American session. The pair’s ongoing relative weakness will likely carry through the new year and it will be interesting to see if ETH/USD begins the new year on the offensive or defensive. ETH/USD Bulls are watching to see if the pair can find some buying pressure above the 120.73 level, representing the 76.4% retracement of the move from 116.25 to 135.24, or find some Bids above the 126.04 area, representing the 23.6% retracement of the 157.73 – 116.25 range.
ETH/USD Bears note that the 50-bar MA (4-hourly) is still trading below the 100-bar MA (4-hourly) and 200-bar MA (4-hourly), a Bearish pattern. Short-term market sentiment may be shifting, however, as the 50-bar MA (hourly) has Bullishly moved above the 100-bar MA (hourly) and 200-bar MA (hourly). Some additional levels that Bears are watching include the 127.14 and 135.90 areas. If ETH/USD fails to gain traction above these areas that are technically relevant and relate to the late-October high of 199.50, additional selling pressure may emerge.
Price activity is nearest the 50-bar MA (4-hourly) at 127.70 and the 200-bar MA (Hourly) at 127.60.
Technical Support is expected around 119.50/ 115.60/ 111.17 with Stops expected below.
Technical Resistance is expected around 137.61/ 141.74/ 146.00 with Stops expected above.
On 4-Hourly chart, SlowK is Bullishly above SlowD while MACD is Bearishly below MACDAverage.
On 60-minute chart, SlowK is Bullishly above SlowD while MACD is Bullishly above MACDAverage.