Sally Ho's Technical Analysis 3 December 2019 BTC ETH
Bitcoin
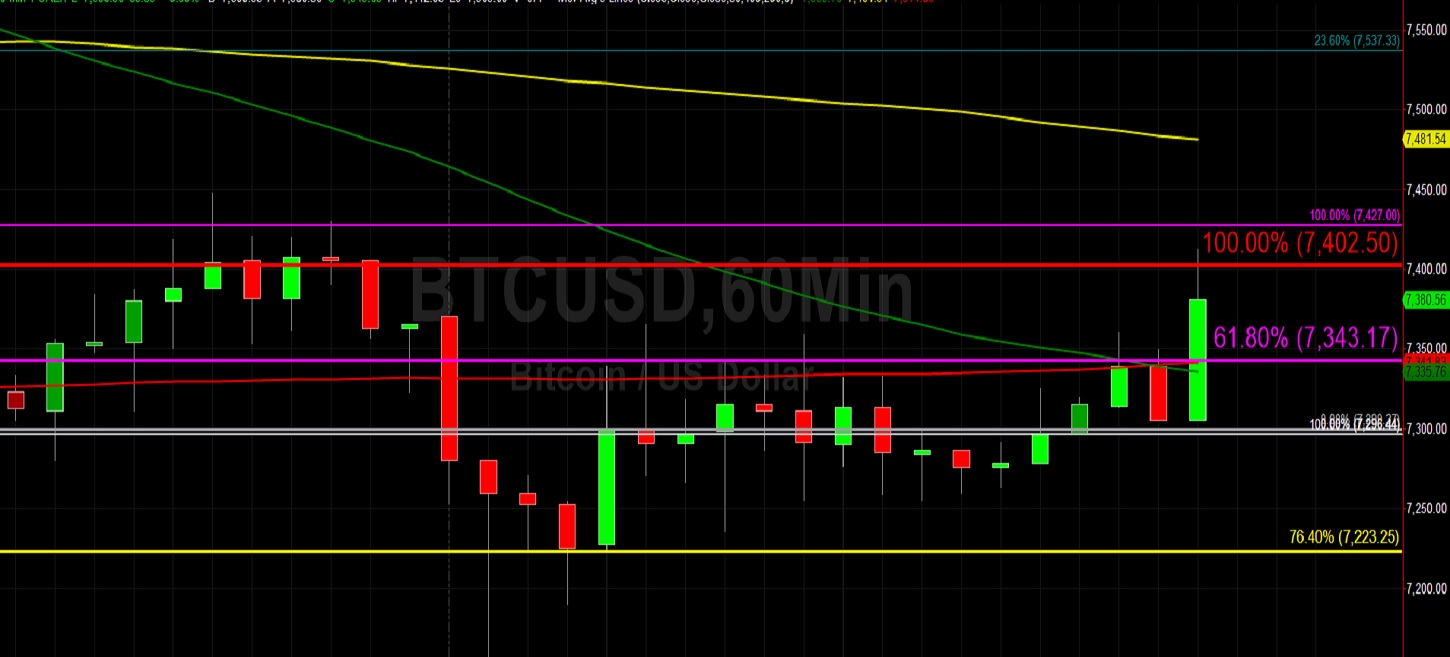
Bitcoin (BTC/USD) moved higher early in today’s Asian session as traders lifted the pair to the 7412.85 area after trading as low as the 7157.33 area during yesterday’s European session. The market has recently given back some of the gains it scored last week when the pair escalated from the 6526.00 area to the 7870.10 level. A couple of good relative measures of the pair’s ongoing weakness include the 7568.81 and 7473.42 areas, both of which represent 23.6% depreciations from recent relative highs including the 10944.67 and 10540.49 levels. During Friday’s North American session, BTC/USD came close to testing another relative yardstick, namely the 7893.48 area that represents the 23.6% retracement of the move from 12320.40 to 6526.00.
Chartists continue to observe an important level around the 7198.05 area, representing the 50% retracement of the recent 6526.00 – 7870.10 range. Notably, the pair has managed to remain Bid above this area during the pullback and also continues to orbit the 7356.65 area, representing the 38.2% retracement of the same range. Below current market activity, traders anticipate some buying pressure around levels including the 7216, 7187, 7053, and 7022 areas. Above current market activity, traders anticipate some selling pressure around levels including the 7722 and 7906 areas.
Price activity is nearest the 100-bar MA (4-hourly) at 7,625.75 and the 50-bar MA (Hourly) at 7,335.95.
Technical Support is expected around 6775.47/ 6653.57/ 6323.42 with Stops expected below.
Technical Resistance is expected around 7870.10/ 8062.04/ 8338.78 with Stops expected above.
On 4-Hourly chart, SlowK is Bullishly above SlowD while MACD is Bearsihly below MACDAverage.
On 60-minute chart, SlowK is Bullishly above SlowD while MACD is Bullishly above MACDAverage.
Ethereum
Ethereum (ETH/USD) appreciated early in today’s Asian session as the pair gained ground and tested the 150.00 figure after trading as low as the 146.82 area during yesterday’s European session. Many traders continue to maintain a relatively weak bias regarding ETH/USD following the pair’s recent trading activity below the 155.00 figure that saw a decline to the 145.97 area. Notably, however, the pair has managed to remain Bid above the 144.77 area during this pullback, an important level that represents the 50% retracement of the recent 131.80 – 157.73 range. The pair’s lack of a decisive market direction reflects ongoing short-term market confusion.
ETH/USD has also orbited the 50-bar MA (4-hourly) for several days, and Bulls note that the 50-bar MA (4-hourly) and 100-bar MA (4-hourly) once again appear to be Bullishly converging. If further price advances are to be notched, the pair will need to establish a constructive base above the 50-bar MA (4-hourly). Chartists also note, however, that the 100-bar MA (hourly) Bearishly crossed above the 50-bar MA (hourly) for the first time in several days, and there is a chance that this could lead to additional price depreciation in the short-term. Likewise, the 200-bar MA (hourly) just bearishly crossed above the 50-bar MA (hourly) and this is likely to coincide with further price depreciation.
Price activity is nearest the 50-bar MA (4-hourly) at 149.34 and the 50-bar MA (Hourly) at 149.07.
Technical Support is expected around 146.35/ 141.02/ 131.80 with Stops expected below.
Technical Resistance is expected around 155.50/ 160.15/ 163.28 with Stops expected above.
On 4-Hourly chart, SlowK is Bullishly above SlowD while MACD is Bearishly below MACDAverage.
On 60-minute chart, SlowK is Bullishly above SlowD while MACD is Bullishly above MACDAverage.
