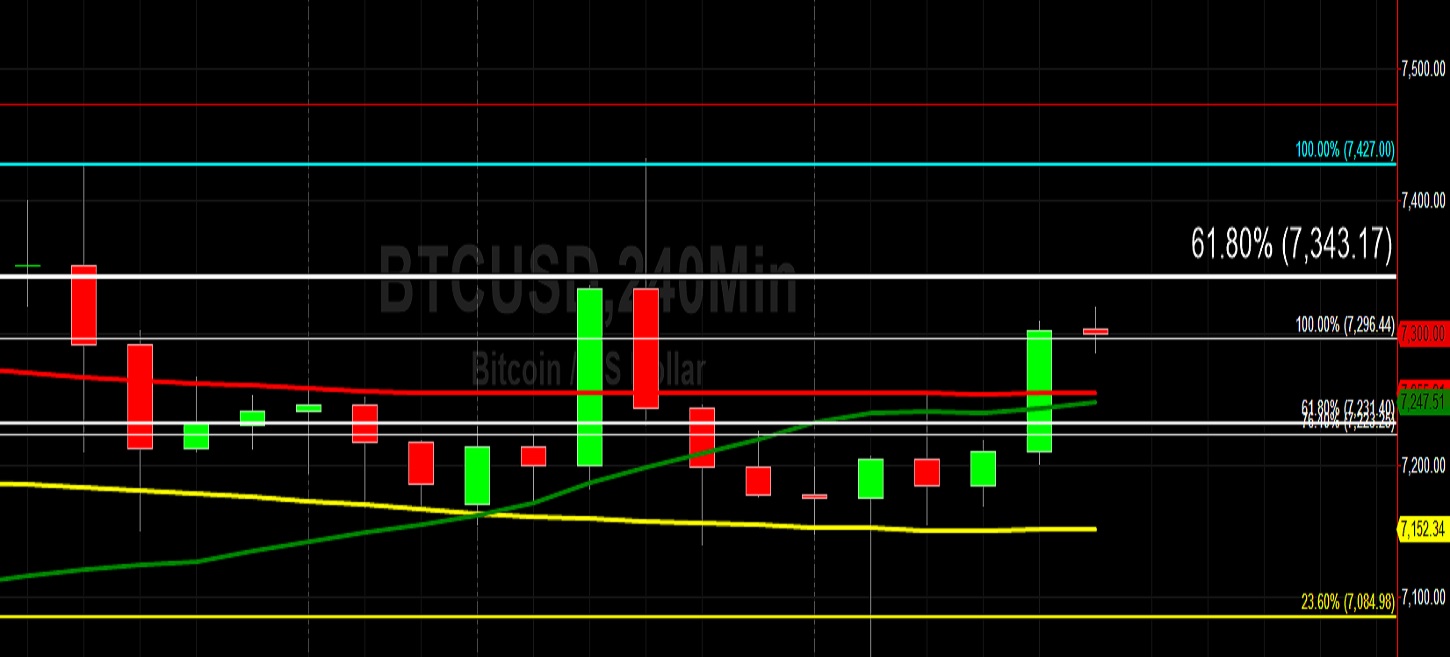
Bitcoin (BTC/USD) gained ground early in today’s Asian session as the pair climbed higher to the 7319.00 level after buying pressure emerged around the 7053.32 area during yesterday’s European session. There has been some renewed market weakness below the 7208.06 area during recent trading sessions and this is significant because that level represents the 38.2% retracement of the move from 6430.00 to 7688.99. Traders are therefore interested to see if BTC/USD can sustain the break above this level. The next downside retracement level in this range is the 7059.50 area, representing a 50% pullback, and below that area traders are watching the 6910.93 level. If that area is breached, traders will pay close attention to the 6727.12 area.
The pair’s trading activity continues to closely follow technical levels and the latest evidence of this is the selling pressure the pair encountered around the 7432.10 area on 26 December, just above the 7420.04 level that represents the 50% retracement of the move from 7688.99 to 7151.08. Likewise, the pair briefly traded above the 7594.48 area on 23 December, and this is technically relevant because that level represents a downside price objective related to the late-October high of 10540.49. The 6899 area is the next major downside price objective related to that late-October high and price activity will be closely watched around this level given the way it has traded around there in the past.
Price activity is nearest the 200-bar MA (4-hourly) at 7,255.15 and the 100-bar MA (Hourly) at 7,271.18.
Technical Support is expected around 6526.00/ 6323.42/ 5941.26 with Stops expected below.
Technical Resistance is expected around 7870.10/ 7927.23/ 8338.78 with Stops expected above.
On 4-Hourly chart, SlowK is Bullishly above SlowD while MACD is Bearishly below MACDAverage.
On 60-minute chart, SlowK is Bullishly above SlowD while MACD is Bullishly above MACDAverage.
Ethereum (ETH/USD) found some upside demand early in today’s Asian session as the pair traded as high as the 128.00 area after Bids emerged around the 122.15 level during yesterday’s European session. Recent short-term spikes to the 134.81 and 135.00 levels lacked the follow-through required to shift market sentiment to a positive bias and a more-recent move higher to the 132.06 level met with additional selling pressure that knocked the pair back below the psychologically-important 125.00 figure. The pair’s recent short-lived moves higher were also deemed relatively shallow because they failed to challenge the 135.90 area, a downside price objective linked to the late-October high of 199.50.
The 123.50 area has emerged as an important short-term level around which some buying pressure has emerged as it represents the 61.8% retracement of the 116.25 – 135.24 range. Below the 123.50 area, the 120.73 level is the next downside price objective related to the recent pullback higher, and if that level is challenged the 116.25 level will come back into view. Below there, the 115.60 and 111.17 levels are technically significant ahead of the 104.77 area. Trading activity also continues to orbit the 50-bar MA (4-hourly), and chartists note that the 100-bar MA (hourly) appears to be Bearishly converging with the 200-bar MA (hourly).
Price activity is nearest the 50-bar MA (4-hourly) at 127.70 and the 200-bar MA (Hourly) at 127.60.
Technical Support is expected around 119.50/ 115.60/ 111.17 with Stops expected below.
Technical Resistance is expected around 137.61/ 141.74/ 146.00 with Stops expected above.
On 4-Hourly chart, SlowK is Bullishly above SlowD while MACD is Bearishly below MACDAverage.
On 60-minute chart, SlowK is Bullishly above SlowD while MACD is Bullishly above MACDAverage.