Bitcoin
Bitcoin (BTC/USD) attempted to add to recent upside trading gains early in today’s Asian session as traders continued to speculate how long the pair would remain above the psychologically-important 7,000 figure. During Sunday’s European session, the pair was pushed higher from the 7125.00 area and traded as high as the 7688.99 level during yesterday’s North American session before giving back some gains. The move higher over the past couple of days was the first time the pair tested the 7568.81 level since 9 December, an area that represents the 23.6% retracement of the move from 10944.67 to 6526.00.
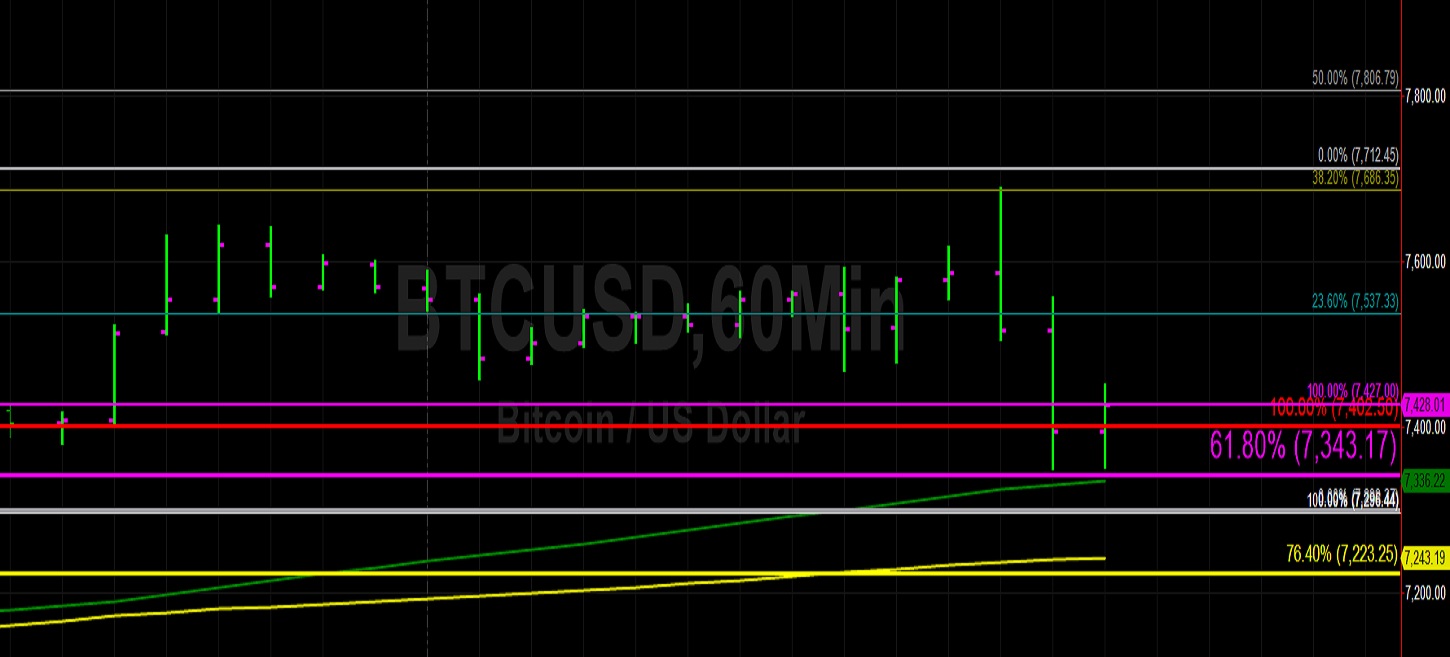
Some Stops were reached above the 200-bar MA (4-hourly) during the pair’s ascent, then indicating around the 7302.53 level. Notably, yesterday’s intraday high was just above the 7686.35 area, representing the 38.2% retracement of the move from 8317.14 to 7296.44. When the pair came off during yesterday’s North American session, Bids emerged around the 7351.00 level, just above the 7343.17 area that represents the 61.8% retracement of the move from 9948.12 to 3128.89. This area of buying pressure was also just above the 50-bar MA (hourly). Below current market activity, Bids are expected around the 7223.25 area, with additional buying pressure around the 7053, 6857, and 6653 areas.
Price activity is nearest the 200-bar MA (4-hourly) at 7,285.58 and the 50-bar MA (Hourly) at 7,330.62.
Technical Support is expected around 6526.00/ 6323.42/ 5941.26 with Stops expected below.
Technical Resistance is expected around 7870.10/ 7927.23/ 8338.78 with Stops expected above.
On 4-Hourly chart, SlowK is Bearishly below SlowD while MACD is Bullishly above MACDAverage.
On 60-minute chart, SlowK is Bearishly below SlowD while MACD is Bearishly below MACDAverage.
Ethereum
Ethereum (ETH/USD) tried to sustain some of its recent gains early in today’s Asian session as the pair attempted to recover from yesterday’s sell-off that saw the pair depreciate from the 135.24 level during yesterday’s Asian session. Traders were unable once again to sustain another move above the 132.90 level, representing the 23.6% retracement of the move from 302.20 to 80.60, and selling pressure also pushed the pair back below the 50-bar MA (4-hourly). During the pair’s plunge yesterday, some Bids emerged around the 100-bar MA (hourly), then indicating around the 128.82 level.
Bids also showed up above the 127.99 area, a level that represents the 38.2% retracement of the move from 118.25 to 135.24. Chartists observe that the 50-bar MA (hourly) and 200-bar MA (hourly) are Bullishly converging and are interested to see if the 50-bar MA (hourly) can cross and remain above for a while. Below current market activity, traders anticipate additional Bids around the 125.75, 123.50, and 120.73 levels. Offers are expected around the 137.92, 140.94, and 141.71 levels. The 50-bar MA (4-hourly) continues to indicate below the 100-bar MA (4-hourly) and 200-bar MA (4-hourly).
Price activity is nearest the 50-bar MA (4-hourly) at 130.24 and the 100-bar MA (Hourly) at 128.85.
Technical Support is expected around 119.50/ 115.60/ 111.17 with Stops expected below.
Technical Resistance is expected around 137.61/ 141.74/ 146.00 with Stops expected above.
On 4-Hourly chart, SlowK is Bearishly below SlowD while MACD is Bullishly above MACDAverage.
On 60-minute chart, SlowK is Bearishly below SlowD while MACD is Bearishly below MACDAverage.