Bitcoin
Bitcoin (BTC/USD) extended its recent rangebound trading behaviour early in today’s Asian session as the pair continued to remain between some important technical trading levels. Traders have kept the pair confined to a relatively tight range for several trading sessions with traders generally keeping BTC/USD between the 50-bar MA (4-hourly) and 100-bar MA (4-hourly). This lack of a clear market sentiment has traders hesitant to adopt fresh trading biases, and this is reflected in the pair’s continued sideways trading patterns.
One level that traders are watching is the 7296.44 area, a previous technical Support level that has recently become technical Resistance. BTC/USD briefly popped above this area last week but the move could not be sustained and the pair quickly settled back to test the 50-bar MA (4-hourly). The 7223.25 area is also a technically significant level, representing the 76.4% retracement of the 8488.00 – 3128.89 range. Above current market activity, traders are looking at potential technical Resistance around the 7365, 7580, and 7722 areas. Below current market activity, traders continue to look at levels including the 6857, 6653, and 6526 areas.
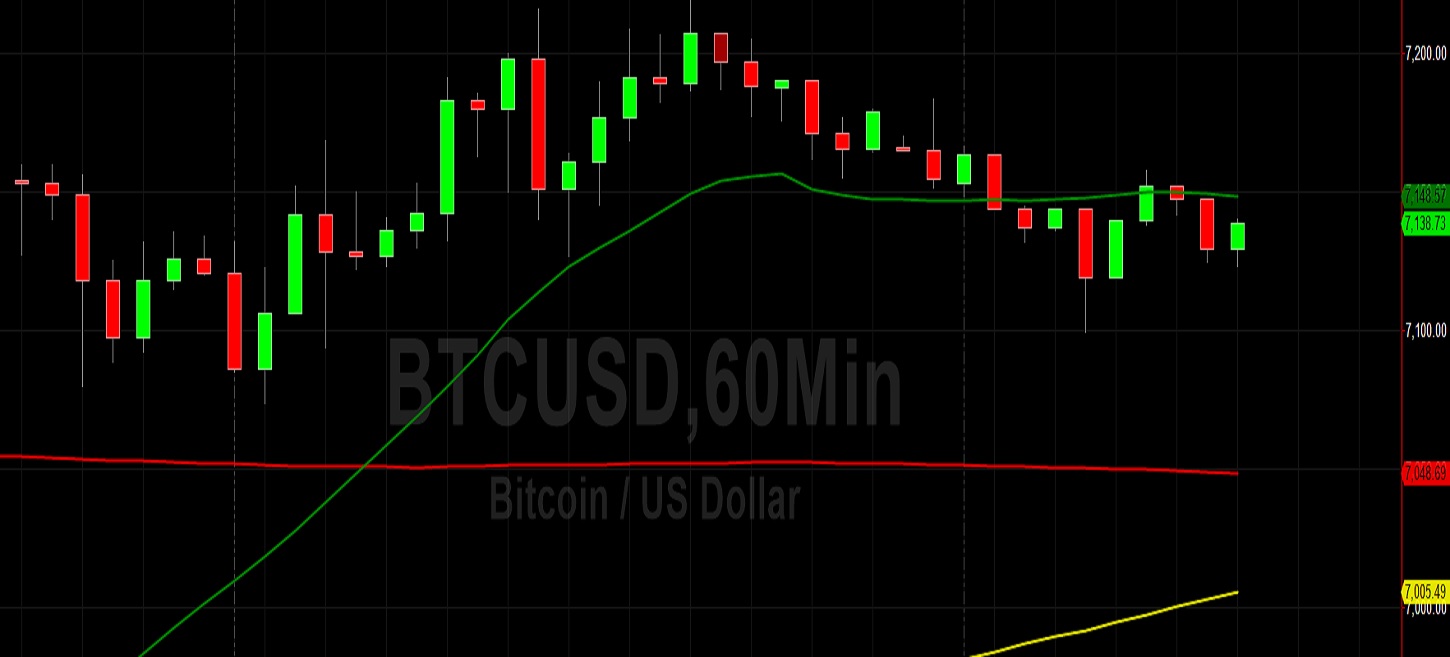
Price activity is nearest the 50-bar MA (4-hourly) at 7,046.86 and the 50-bar MA (Hourly) at 7,148.45.
Technical Support is expected around 6526.00/ 6323.42/ 5941.26 with Stops expected below.
Technical Resistance is expected around 7568.81/ 7870.10/ 8338.78 with Stops expected above.
On 4-Hourly chart, SlowK is Bearishly below SlowD while MACD is Bullishly above MACDAverage.
On 60-minute chart, SlowK is Bearishly below SlowD while MACD is Bearishly below MACDAverage.
Ethereum
Ethereum (ETH/USD) extended its sideways trading pattern early in today’s Asian session as the pair lacked a fresh trading impetus to push it higher or lower. ETH/USD recently made a temporary push above the 132.90 area, but traders have thereafter kept the pair below this level, an important one that represents the 23.6% retracement of the move from 302.20 to 80.60. Chartists have noted that the 50-bar MA (hourly) and 100-bar MA (hourly) have Bullishly converged, a development that may lead to additional price appreciation. Simultaneously, the 50-bar MA (4-hourly) still continues to trade below the 100-bar MA (4-hourly) and 200-bar MA (4-hourly), and this evidences the pair’s longer-term bearishness.
Another important level that traders continue to watch is the 127.14 area, representing the 23.6% retracement of the move from 199.56 to 104.77. Short-term technical Support around the 125.53 area has recently held, and this level is important as it represents the 50% retracement of the recent move from 116.25 to 134.81. Below that level, traders anticipate some technical Support around the 123.34 and 120.63 areas. Above that level, traders eye technical Resistance around the 130.43 area, representing the 23.6% retracement of the 116.25 to 134.81 range.
Price activity is nearest the 50-bar MA (4-hourly) at 133.49 and the 50-bar MA (Hourly) at 127.34.
Technical Support is expected around 119.50/ 115.60/ 111.17 with Stops expected below.
Technical Resistance is expected around 137.61/ 141.74/ 146.00 with Stops expected above.
On 4-Hourly chart, SlowK is Bearishly below SlowD while MACD is Bullishly above MACDAverage.
On 60-minute chart, SlowK is Bearishly below SlowD while MACD is Bullishly above MACDAverage.