Bitcoin
Bitcoin (BTC/USD) continued recent movements in today’s Asian session as the pair orbited the 7084.98 area, representing the 23.6% retracement of the 19891.99 – 3129.89 range. Price activity has been confined to a relatively tight range for several trading sessions with traders generally keeping BTC/USD between the 50-bar MA (4-hourly) and 100-bar MA (4-hourly). Chartists note that the 50-bar MA (hourly) recently Bullishly crossed above the 100-bar MA (hourly) and 200-bar MA (hourly), a development that may coincide with additional price appreciation. Also, the 100-bar MA (hourly) and 200-bar MA (hourly) are Bullishly converging.
Traders continue to monitor another level that has recently been toppish for the pair, namely the 7223.25 area, representing the 76.4% retracement of the 8488.00 – 3128.89 range. Above current market activity, traders are looking at potential technical Resistance around the 7365, 7580, and 7722 areas. Below current market activity, traders continue to look at levels including the 6857, 6653, and 6526 areas. Bids were seen last week around the 6430 area but follow-through activity evaporated around the 200-bar MA (4-hourly).
Price activity is nearest the 50-bar MA (4-hourly) at 7,046.86 and the 50-bar MA (Hourly) at 7,148.45.
Technical Support is expected around 6526.00/ 6323.42/ 5941.26 with Stops expected below.
Technical Resistance is expected around 7568.81/ 7870.10/ 8338.78 with Stops expected above.
On 4-Hourly chart, SlowK is Bearishly below SlowD while MACD is Bullishly above MACDAverage.
On 60-minute chart, SlowK is Bearishly below SlowD while MACD is Bearishly below MACDAverage.
Ethereum
Ethereum (ETH/USD) maintained its relatively tight range early in today’s Asian session as the pair continued to trade above the 122.75 area, a relative historic low that coincided with the pair’s eventual climb to the 364.49 area. Even though ETH/USD recently made a temporary push above the 132.90 area, traders have kept the pair below this level, an important one that represents the 23.6% retracement of the move from 302.20 to 80.60. Chartists have noted that the 50-bar MA (hourly) and 100-bar MA (hourly) have Bullishly converged, a development that may lead to additional price appreciation. Simultaneously, the 50-bar MA (4-hourly) still continues to trade below the 100-bar MA (4-hourly) and 200-bar MA (4-hourly).
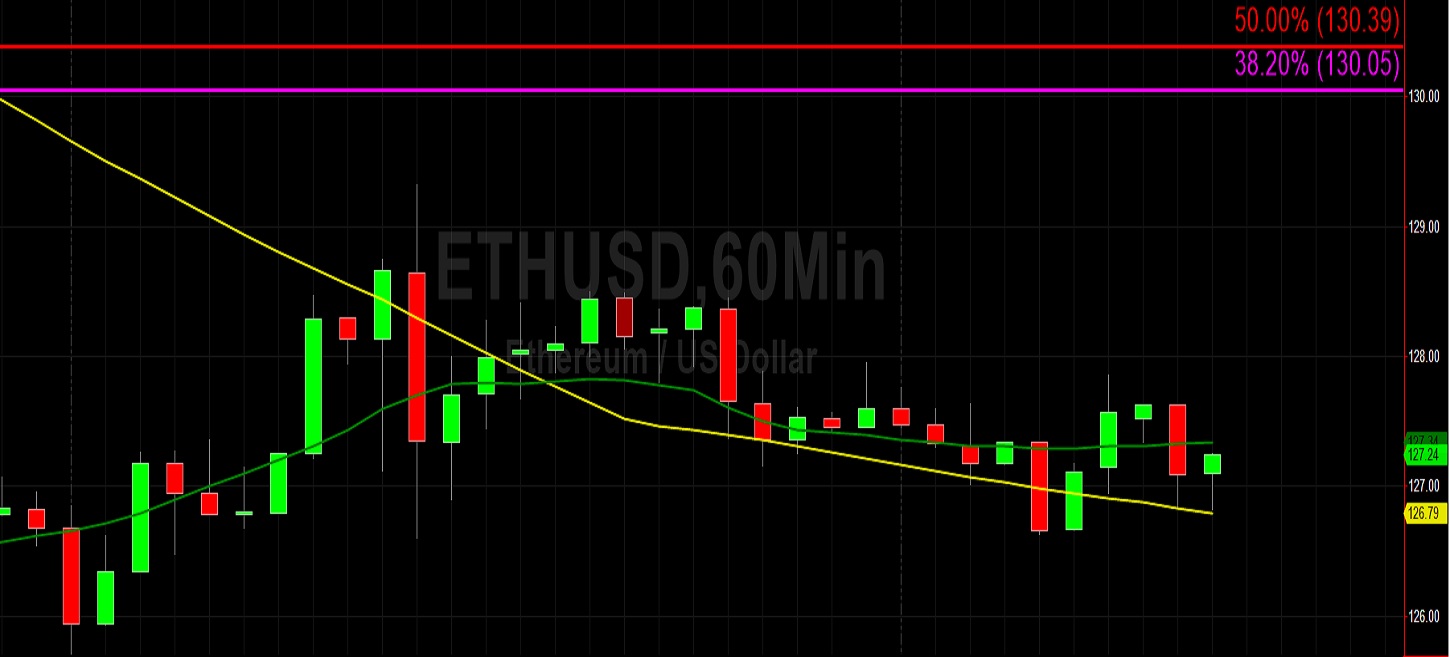
Another important level that traders continue to watch is the 127.14 area, representing the 23.6% retracement of the move from 199.56 to 104.77. Short-term technical Support around the 125.53 area has recently held, and this level is important as it represents the 50% retracement of the recent move from 116.25 to 134.81. Below that level, traders anticipate some technical Support around the 123.34 and 120.63 areas. Above that level, traders eye technical Resistance around the 130.43 area, representing the 23.6% retracement of the 116.25 to 134.81 range.
Price activity is nearest the 50-bar MA (4-hourly) at 133.49 and the 50-bar MA (Hourly) at 127.34.
Technical Support is expected around 119.50/ 115.60/ 111.17 with Stops expected below.
Technical Resistance is expected around 137.61/ 141.74/ 146.00 with Stops expected above.
On 4-Hourly chart, SlowK is Bearishly below SlowD while MACD is Bullishly above MACDAverage.
On 60-minute chart, SlowK is Bearishly below SlowD while MACD is Bullishly above MACDAverage.