Bitcoin
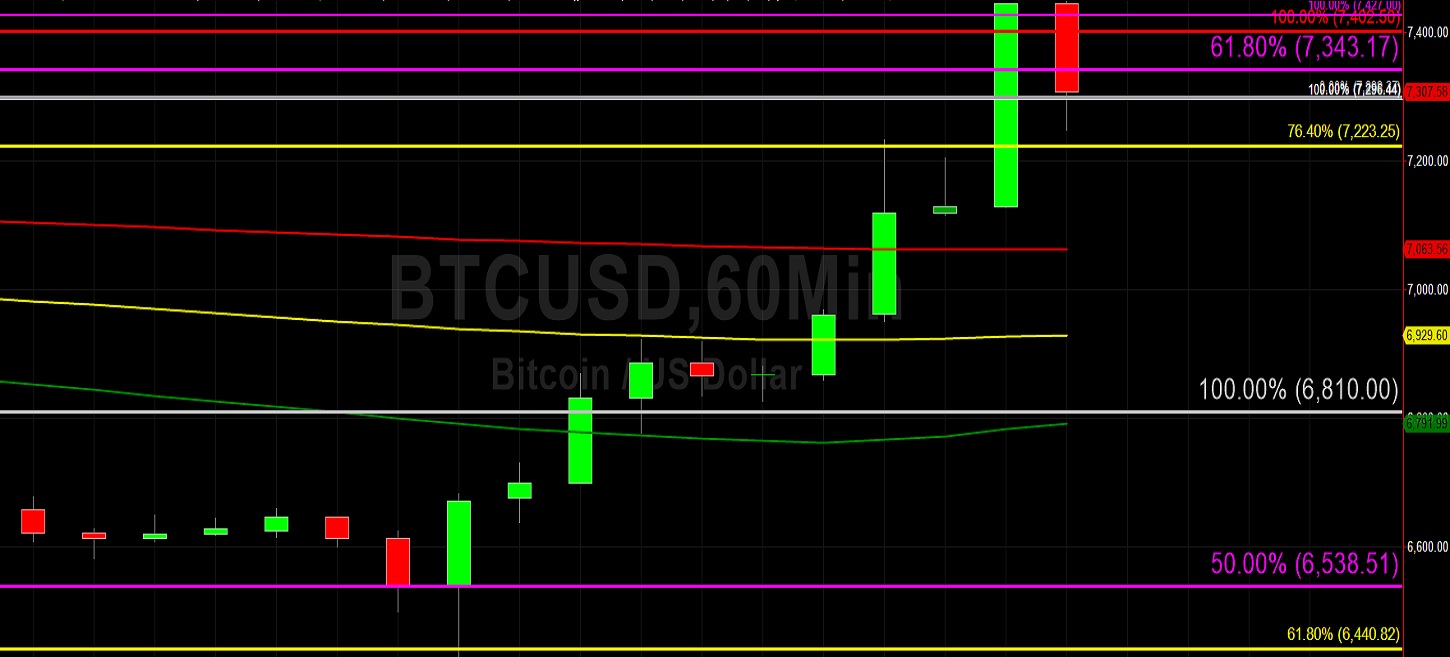
Bitcoin (BTC/USD) rocketed higher in today’s Asian session as the pair was lifted higher to the 7298.00 area, a steady climb from the 6430.00 area reached early in yesterday’s North American session. Market sentiment has been weak especially as the pair tests lower lows, but the recent severe selling pressure also increases the possibility of a rapid short covering higher. Stops were elected below the 6526.00 area during yesterday’s European session, establishing a new multi-month low after traders were able to drive the pair below the late-November low down to the 6430.00 area. Below that level, the next downside target is the 6323.42 level and then the 6038.82 area is a downside price objective. This area became technically relevant following the pair’s test of the 9150.00 level on 10 November. The significance of this level became confirmed in late November when sizable Stops were triggered below the 6899 area, a related level.
If BTC/USD Bears continue to dominate the market, chartists will eye the 4648 area as an aggressive downside price objective related to the same levels. Traders are interested to see how the pair will react around the 6538.51 level in the near-term. Weakness in price activity around this level will open up the 5733.84 level, an area that represents the 38.2% retracement of the move from 9948.12 to 3128.89. The 50-bar MA (4-hourly) is trading above the 100-bar MA (4-hourly) and 200-bar MA (4-hourly), while the 50-bar (hourly) is trading above the 100-bar MA (hourly) and 200-bar MA (hourly). Collectively, these indicators are indicative of a weaker BTC/USD.
Price activity is nearest the 200-bar MA (4-hourly) at 7,445.89 and the 200-bar MA (Hourly) at 7,063.89.
Technical Support is expected around 6526.00/ 6323.42/ 5941.26 with Stops expected below.
Technical Resistance is expected around 7568.81/ 7870.10/ 8338.78 with Stops expected above.
On 4-Hourly chart, SlowK is Bullishly above SlowD while MACD is Bullishly above MACDAverage.
On 60-minute chart, SlowK is Bearishly below SlowD while MACD is Bullishly above MACDAverage.
Ethereum
Ethereum (ETH/USD) appreciated early in today’s Asian session as the pair was lifted to the 134.81 level after Bids emerged around the 116.25 area early in yesterday’s North American session. Traders saw some interesting volatility early in yesterday’s North American session when the pair traded as low as the 116.25 area before climbing back towards the 125.00 figure. This represented the pair’s weakest print since February of this year and was reached after Stops were elected below the 122.75 area, a relative historical low that resulted in the pair’s ascent to the 364.49 area. Chartists saw some Stops elected above the 132.90 area during yesterday’s rebound, a notable development as it represents the 23.6% retracement of the 302.20 – 80.60 range.
Yesterday’s move to the 116.25 area was also technically interesting because buying pressure emerged above the 115.60 area, representing the 76.4% retracement of the move from 100.15 to 165.62. Some buying pressure is anticipated ahead of the 114.40 area if the markets continue to deteriorate. The 50-bar MA (4-hourly) is trading above the 100-bar MA (4-hourly) and 200-bar MA (4-hourly), while the 50-bar (hourly) is trading above the 100-bar MA (hourly) and 200-bar MA (hourly). These indicators’ activity reflects the ongoing weakness of ETH/USD.
Price activity is nearest the 50-bar MA (4-hourly) at 138.81 and the 100-bar MA (Hourly) at 134.07.
Technical Support is expected around 119.50/ 115.60/ 111.17 with Stops expected below.
Technical Resistance is expected around 137.61/ 141.74/ 146.00 with Stops expected above.
On 4-Hourly chart, SlowK is Bullishly above SlowD while MACD is Bullishly above MACDAverage.
On 60-minute chart, SlowK is Bullishly above SlowD while MACD is Bullishly above MACDAverage.