Sally Ho's Technical Analysis 18 December 2019 BTC ETH
Bitcoin
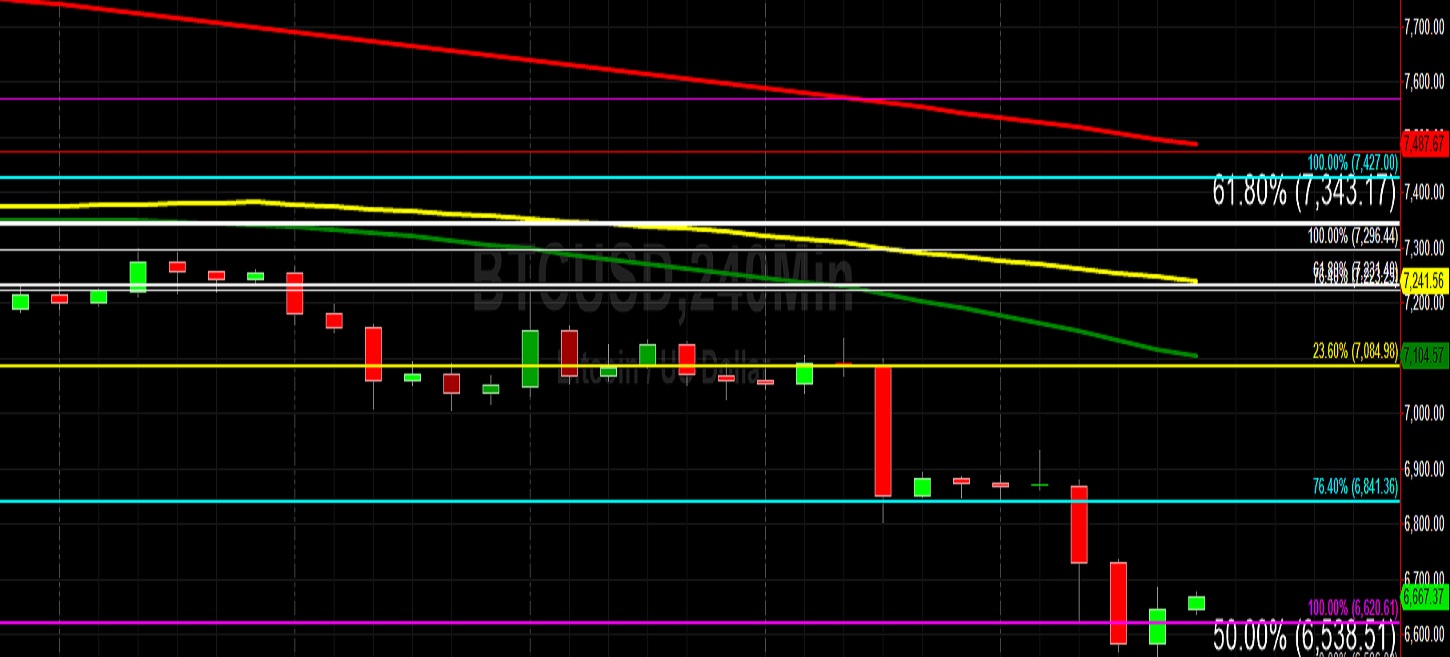
Bitcoin (BTC/USD) gained back some ground early in today’s Asian session as the pair was lifted to the 6685.75 area after trading as low as the 6556.00 level late in yesterday’s North American session. Aside from a move to the 6933.21 area during yesterday’s European session, BTC/USD has steadily depreciated since its print around the 7137.00 area during Monday’s North American session. BTC/USD Bears continue to drive market dynamics at the expense of BTC/USD Bulls and this has led to a steady erosion in value over the past several weeks. One measure of the pair’s weakness is its continued pressure below the 7473.42 area, a level that represents the 23.6% retracement of the move from 10540.49 to 6526.00. As the market continues to slump closer to the psychologically-important 7000 figure, a test of some key technical levels including the 6899.15 and 6843.21 areas will become even more possible.
A test of the recent 6526.00 low itself is also possible and this could lead to a significant repricing of market risk. One area below this level that traders are closely watching is the 6038.82 area, a technically significant area that became relevant after traders failed to take the market above the 9150.00 area on 10 November. The next downside level in this particular range below the 6038 area is the 4648 area and while this level seems far away, BTC/USD’s historic volatility has resulted in very large upside and downside moves. The 50-bar MA (4-hourly) is trading above the 100-bar MA (4-hourly) and 200-bar MA (4-hourly), while the 50-bar (hourly) is trading above the 100-bar MA (hourly) and 200-bar MA (hourly). Collectively, these indicators favour a weaker BTC/USD.
Price activity is nearest the 50-bar MA (4-hourly) at 7,253.84 and the 50-bar MA (Hourly) at 7,116.23.
Technical Support is expected around 6526.00/ 6323.42/ 5941.26 with Stops expected below.
Technical Resistance is expected around 7084.98/ 7343.17/ 7870.10 with Stops expected above.
On 4-Hourly chart, SlowK is Bearishly below SlowD while MACD is Bearishly below MACDAverage.
On 60-minute chart, SlowK is Bullishly above SlowD while MACD is Bearishly below MACDAverage.
Ethereum
Ethereum (ETH/USD) was lifted early in today’s Asian session as the pair climbed to the 125.45 area after trading as low as the 119.50 area during yesterday’s North American session. Stops were triggered below the 122.75 area during the move lower, a relative low that had last traded on 4 March this year. As traders continue to reprice market risk, the likelihood of a further downside move continues to increase. The break below the 132.90 area, a downside price objective that represents the 23.6% retracement of the 302.20 – 80.60 range, has opened up additional downside targets.
One such target that was tested and broken is the 127.14 area, a downside price objective. After the 131.80 area was also pierced, traders were able to absorb the 127.14 level and elect Stops below it. The technical significance of this level was clearly established on 20 November when ETH/USD Bulls failed to take the pair above the 177.25 area. Traders will continue to monitor price activity around the 137.92 area, a level that represents the 76.4% retracement of the 131.80 – 157.73 range.
Price activity is nearest the 50-bar MA (4-hourly) at 140.84 and the 50-bar MA (Hourly) at 133.38.
Technical Support is expected around 119.50/ 115.60/ 111.17 with Stops expected below.
Technical Resistance is expected around 130.05/ 137.61/ 141.74 with Stops expected above.
On 4-Hourly chart, SlowK is Bullishly above SlowD while MACD is Bearishly below MACDAverage.
On 60-minute chart, SlowK is Bullishly above SlowD while MACD is Bearsihly below MACDAverage.
