Bitcoin
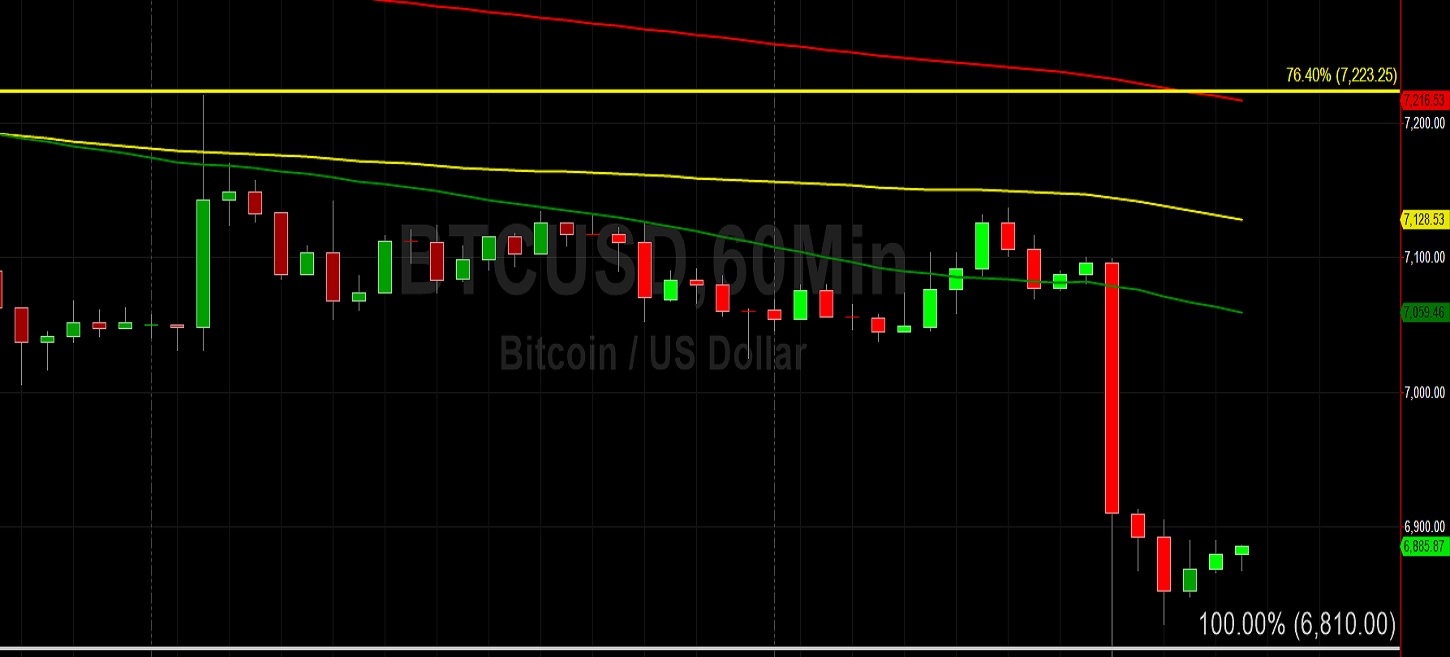
Bitcoin (BTC/USD) moved marginally higher early in today’s Asian session as the pair traded as high as the 6890.00 level following its rapid depreciation to the 6803.24 area during yesterday’s North American session. Stops were elected below the 6841.36 area during the move lower, representing the 76.4% retracement of the move from 4670.53 to 13868.44. The pair’s inability to sustain upward movements in price became evident again on Sunday when the pair was pushed higher to the 7220.01 area but qiuickly came off, its latest failure to sustain follow-through buying. Thereafter, the pair became pressured below the 7084.98 level, representing the 23.6% retracement of the move from 19891.99 to 3128.89. Sunday’s daily high was just below the 7223.25 area that represents the 76.4% retracement of the move from 8488.00 to 3128.89. As a result of these shallower highs, a stronger downward bias is clearly developing.
Chartists also note that the pair thrice tested the 50-bar MA (hourly) yesterday and then came off, adding to the pair’s weaker sentiment. Over the last few days, traders have chipped away at technical Support below the 7039.45 area, a level that represents the 61.8% retracement of the 6526.00 – 7870.10 range. A definitive break below this level will open up a possible test of the 6843.21 level, an area that represents the 76.4% retracement of the same range. Another important level that traders are monitoring is the 6899.15 area, a downside price objective related to the pair’s late-October high of 10540.49 and subsequent test of the 9150.00 area.
Price activity is nearest the 50-bar MA (4-hourly) at 7,204.56 and the 50-bar MA (Hourly) at 7,059.24.
Technical Support is expected around 6775.47/ 6653.57/ 6323.42 with Stops expected below.
Technical Resistance is expected around 7870.10/ 8062.04/ 8338.78 with Stops expected above.
On 4-Hourly chart, SlowK is Bearishly below SlowD while MACD is Bearishly below MACDAverage.
On 60-minute chart, SlowK is Bullishly above SlowD while MACD is Bearishly below MACDAverage.
Ethereum
Ethereum (ETH/USD) gained a little ground back early in today’s Asian session as the pair climbed to the 132.53 area after trading as low as the 129.03 area during yesterday’s North American session. Major Stops were elected below the 132.90 area, representing the 23.6% retracement of the 302.20 – 80.60 range. Stops were also triggered below the 131.80 area, a previous relative low. Downward risks continue to strengthen as the pair continues to trade well below the psychologically-important 150.00 figure and traders probe buying pressure at lower lows. While this reflects weakening market sentiment that could see ETH/USD tumble further, the risks of a short squeeze higher also increase if traders conclude the pair is oversold.
The 141.71 area represents the 61.8% retracement of the 131.80 – 157.53 range, and traders have again been able to absorb Bids well below this level. This pair rampaged below 137.92 area, a level that represents the 76.4% retracement of the aforementioned 131.80 – 157.73 range. Below that area, the 131.80 area itself fell and this has opened up the 127.14 area, a downside price objective related to the late-October high of 199.50 and subsequent test of the 177.25 area. Price activity is nearest the 50-bar MA (4-hourly) at 145.03 and the 50-bar MA (Hourly) at 142.40.
Technical Support is expected around 127.14/ 125.16/ 122.75 with Stops expected below.
Technical Resistance is expected around 141.71/ 146.59/ 149.31 with Stops expected above.
On 4-Hourly chart, SlowK is Bearishly below SlowD while MACD is Bearishly below MACDAverage.
On 60-minute chart, SlowK is Bullishly above SlowD while MACD is Bearsihly below MACDAverage.