Bitcoin
Bitcoin (BTC/USD) weakened early in today’s Asian session as the pair fell to the 7006.01 area after trading as high as the 7264.33 level during yesterday’s European session. Traders are awaiting the next major cues from market developments to adjust their market biases. The market has recently traded around the 7084.98 area, a very important technical area that represents the 23.6% retracement of the move from 19891.99 to 3128.89. Traders were able to elect Stops below this level during yesterday’s North American session and the pair moved to the 7008.03 area in short order. Stops were also hit below the 7039.45 area during the move lower. Decent Stops were last triggered below this area on 22 November and the pair skidded lower to the 6775.47 area, underscoring its technical significance.
Along the same lines, traders are watching the 7893.48 area on the upside, a technical level that represents the 23.6% retracement of the 12320.40 – 6526.00 range. The market gained ground and tested this level after establishing a multi-month low around the 6526.00 area late last month. Since then, the pair has exhibited some interesting volatility that has resulted in multiple spikes to the upside that have been unsustainable. These have included moves to the 7775 and 7659 areas. Chartists note that BTC/USD needs to shortly contend with the 50-bar MA (4-hourly) and 100-bar MA (4-hourly) if traders are able to engineer a move to the upside.
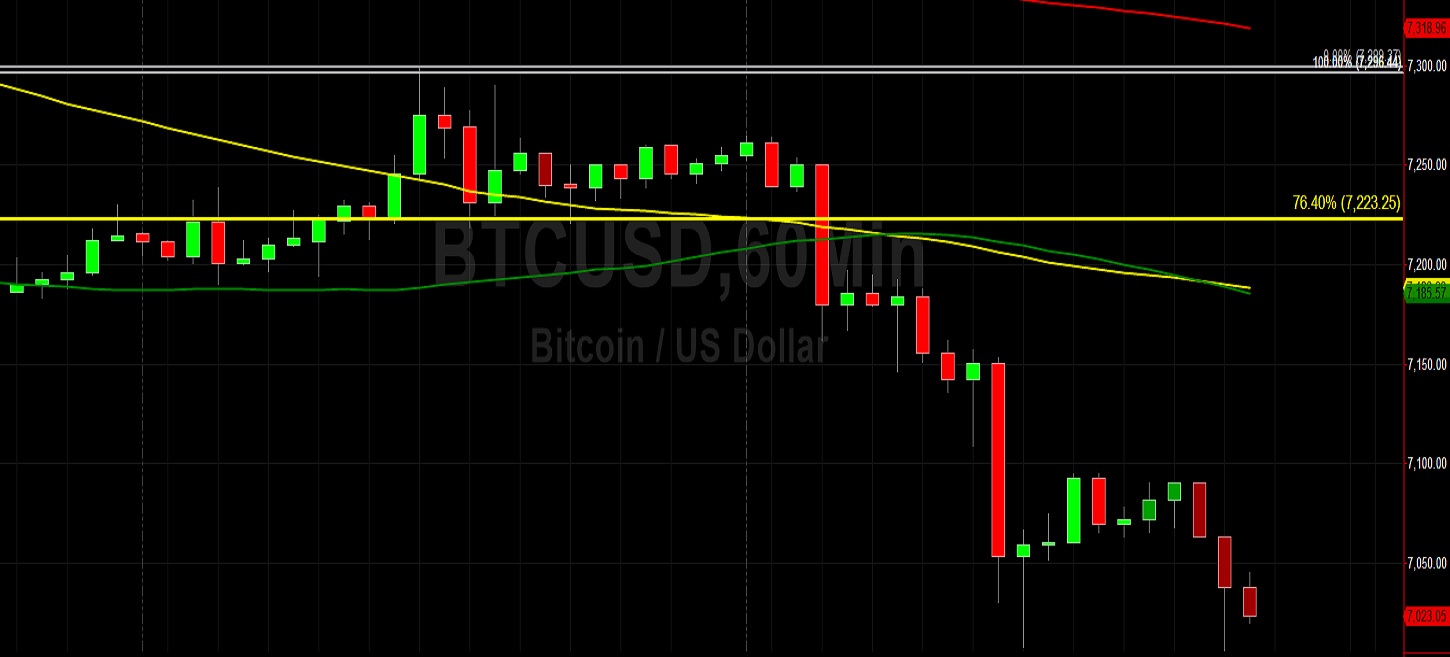
Price activity is nearest the 50-bar MA (4-hourly) at 7,306.04 and the 50-bar MA (Hourly) at 7,185.89.
Technical Support is expected around 6775.47/ 6653.57/ 6323.42 with Stops expected below.
Technical Resistance is expected around 7870.10/ 8062.04/ 8338.78 with Stops expected above.
On 4-Hourly chart, SlowK is Bearishly below SlowD while MACD is Bearishly below MACDAverage.
On 60-minute chart, SlowK is Bearishly below SlowD while MACD is Bearishly below MACDAverage.
Ethereum
Ethereum (ETH/USD) depreciated early in today’s Asian session as the pair fell to the 139.80 area after being capped around the 144.99 level during yesterday’s Asian session. Stops were elected below the 140.98 area, representing the 38.2% retracement of the 199.56 – 104.77 range – late in the North American session and the pair quickly fell to the 139.80 level. ETH/USD Bears are now eyeing the 137.93 area as a downside price objective, representing the 76.4% retracement of the 131.80 – 157.73 range. The market has recently gravitated to the 144.19 and 144.77 areas, with the former representing the 50% retracement of the move from 165.62 to 122.75 and the latter representing the 50% retracement of the move from 131.80 to 157.73.
Traders had also been watching the 141.71 area as it represents the 61.8% retracement of the 131.80 – 157.73 range and traders were able to push the pair below this area last week and test some buying pressure as low as the 139.10 area. Above current market activity, the 146.00 figure remains a very important technical level, as it was previously a relative low related to the market’s eventual appreciation to the 364.49 area. Traders have recently tested this area but it has capped ETH/USD’s movements, an example of former technical Support becoming technical Resistance. Above current market activity, traders are eyeing the 50-bar MA (4-hourly) and 100-bar MA (4-hourly) and considering whether they will slow the pair’s possible climb higher before a possible test of selling pressure that is expected between the 151.61 and 153.00 levels.
Price activity is nearest the 50-bar MA (4-hourly) at 145.74 and the 50-bar MA (Hourly) at 143.51.
Technical Support is expected around 137.92/ 131.80/ 127.14 with Stops expected below.
Technical Resistance is expected around 146.59/ 149.31/ 152.11 with Stops expected above.
On 4-Hourly chart, SlowK is Bearishly below SlowD while MACD is Bearishly below MACDAverage.
On 60-minute chart, SlowK is Bearishly below SlowD while MACD is Bearsihly below MACDAverage.