Bitcoin
Bitcoin (BTC/USD) weakened early in today’s Asian session as the pair traded as low as the 7499.04 area after trading as high as the 7820.00 area during yesterday’s European session. BTC/USD has twice tested the 100-bar MA (4-hourly) during recent trading sessions, an indication of upward price pressure. Traders are observing that BTC/USD is in a clash between Bears who sold the pair following its depreciation from the 10540.49 area and Bulls who have purchased the pair following its recent recovery from the 6526.00 level. Chartists are observing some important clues including Bids that emerged during Friday’s North American session near the 7568 area, right around the 23.6% retracement of the move from 10944.67 to 6526.00. Notably, BTC/USD stopped just short of testing the 7893.48 area during the move higher, representing the 23.6% retracement of the move from 12320.40 to 6526.00.
Above current market activity, the 7906 area represents a technical exhaustion point and it is likely Stops are in place above this level. A resumption of upward buying pressure will see chartists focus on the recent pullback to the 7370 level, meaning some upside price objectives will include the 8304 and 8723 areas. Traders anticipate some significant selling pressure ahead of the 8289 area, a downside price objective target related to the recent high around the 10540.49 area. The technical significance of this level was confirmed when significant Stops were elected below the level on 18 November. Additional upside price objectives include the 8304, 8723, 9242, and 10081 levels. Below current market activity, traders anticipate some Bids around the 7473.42 area, a level that represents the 23.6% retracement of the move from 10540.49 to 6526.
Price activity is nearest the 50-bar MA (4-hourly) at 7,325.11 and the 100-bar MA (Hourly) at 7,502.29.
Technical Support is expected around 6775.47/ 6653.57/ 6323.42 with Stops expected below.
Technical Resistance is expected around 7870.10/ 8062.04/ 8338.78 with Stops expected above.
On 4-Hourly chart, SlowK is Bearishly below SlowD while MACD is Bearishly below MACDAverage.
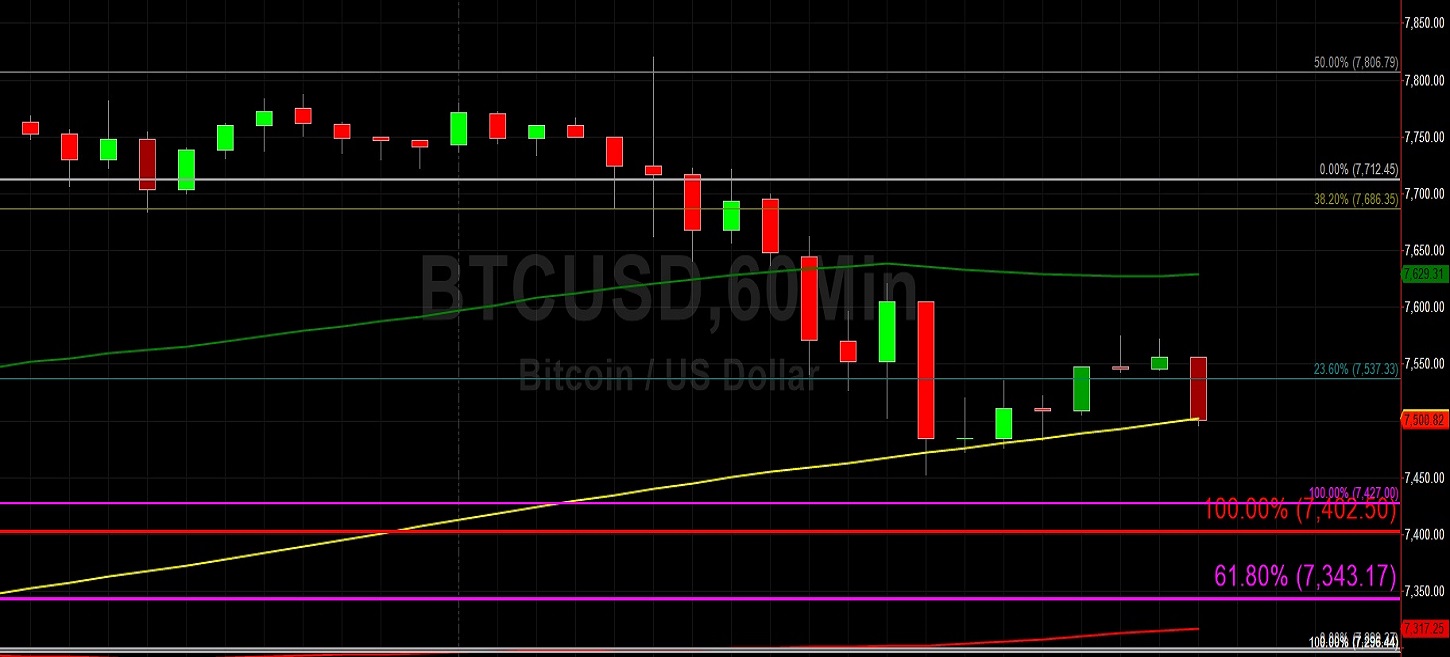
On 60-minute chart, SlowK is Bullishly above SlowD while MACD is Bearishly below MACDAverage.
Ethereum
Ethereum (ETH/USD) traded lower early in today’s Asian session as the pair reached the 150.51 area after trading as high as the 155.45 area during Friday’s Asian session. Bids emerged late in yesterday’s North American session around the 100-bar MA (4-hourly), then indicating around the 149.60 area. The recent buying pressure that has seen the pair lifted from the 131.80 area is now colliding with the selling pressure that saw the pair aggressively sold from the 199.50 area over the past several weeks. Some clues have emerged about this clash during recent trading sessions. Stops were reached above the 152.10 level on 27 November, a price level that represents a downside price objective related to the depreciation from the 199.50 area, and an area below which significant Stops were triggered on 22 November.
Stops were also reached above the 156.99 area yesterday, an important upside price objective target related to the pair’s recent low around the 131.80 area. Those Stops were elected only after Stops were elected above the 155.74 area, an upside price objective target that became technically relevant after a pullback to the 141.02 area. There are a series of upside price objective targets related to some of these levels and they are around the 160.15, 161.39, 168.91, and 170.53 levels. Before tackling some of those levels, however, traders will need to challenge levels such as the 163.28 and 165.11 areas, both of which are also downside price objective targets related to the recent depreciation from the 199.50 level. Chartists are also eyeing the 168.07 area as an interesting one that represented a downside price objective target during the pair’s recent decline and below which Stops were elected.
Price activity is nearest the 50-bar MA (4-hourly) at 149.57 and the 200-bar MA (Hourly) at 149.53.
Technical Support is expected around 149.24/ 146.35/ 141.74 with Stops expected below.
Technical Resistance is expected around 160.15/ 163.28/ 168.07 with Stops expected above.
On 4-Hourly chart, SlowK is Bearishly below SlowD while MACD is Bearishly below MACDAverage.
On 60-minute chart, SlowK is Bearishly below SlowD while MACD is Bearishly below MACDAverage.