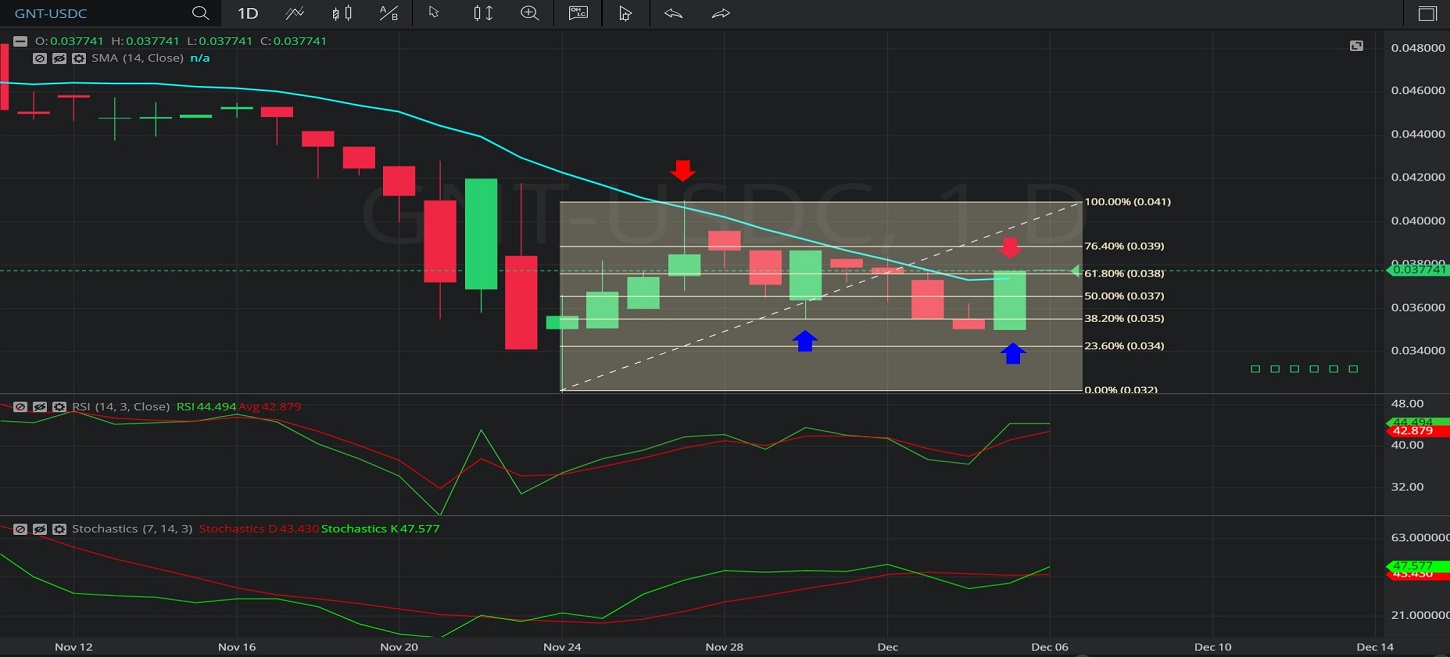
In this Daily chart of Golem/ USD Coin (GNT/ USDC), there is an appreciating range from 0.03209 to 0.041.
We can see that the top part of the appreciating range (identified by the first red down arrow) is near the 14-bar Simple Moving Average.
We can see that the market then depreciated to the 0.0355 area (identified by the first blue up arrow), just above the 0.035494 level that represents the 61.8% retracement of the appreciating range.
We can see the market then depreciated again to the 0.035 level (identified by the second blue up arrow), right around the 61.8% retracement of the appreciating range.
We can then see the market traded as high as the 0.037741 level (identified by the second red down arrow), just below the 0.037596 area that represents the 38.2% retracement of the appreciating range.
Using RSI, we can observe the slopes of both RSI (14) and RSI Average (3) were positive after the market traded as low as the 0.035 level, and that RSI (14) bullishly crossed above RSI Average (3).
Using Slow Stochastics, we can see the slope of Stochastics K turned positive after the market traded as low as the 0.35 level, and that Stochastics K has bullishly just crossed above Stochastics D, indicating further price appreciation is possible.
Stay on top of the cryptocurrency market with CryptoDaily’s trading charts!