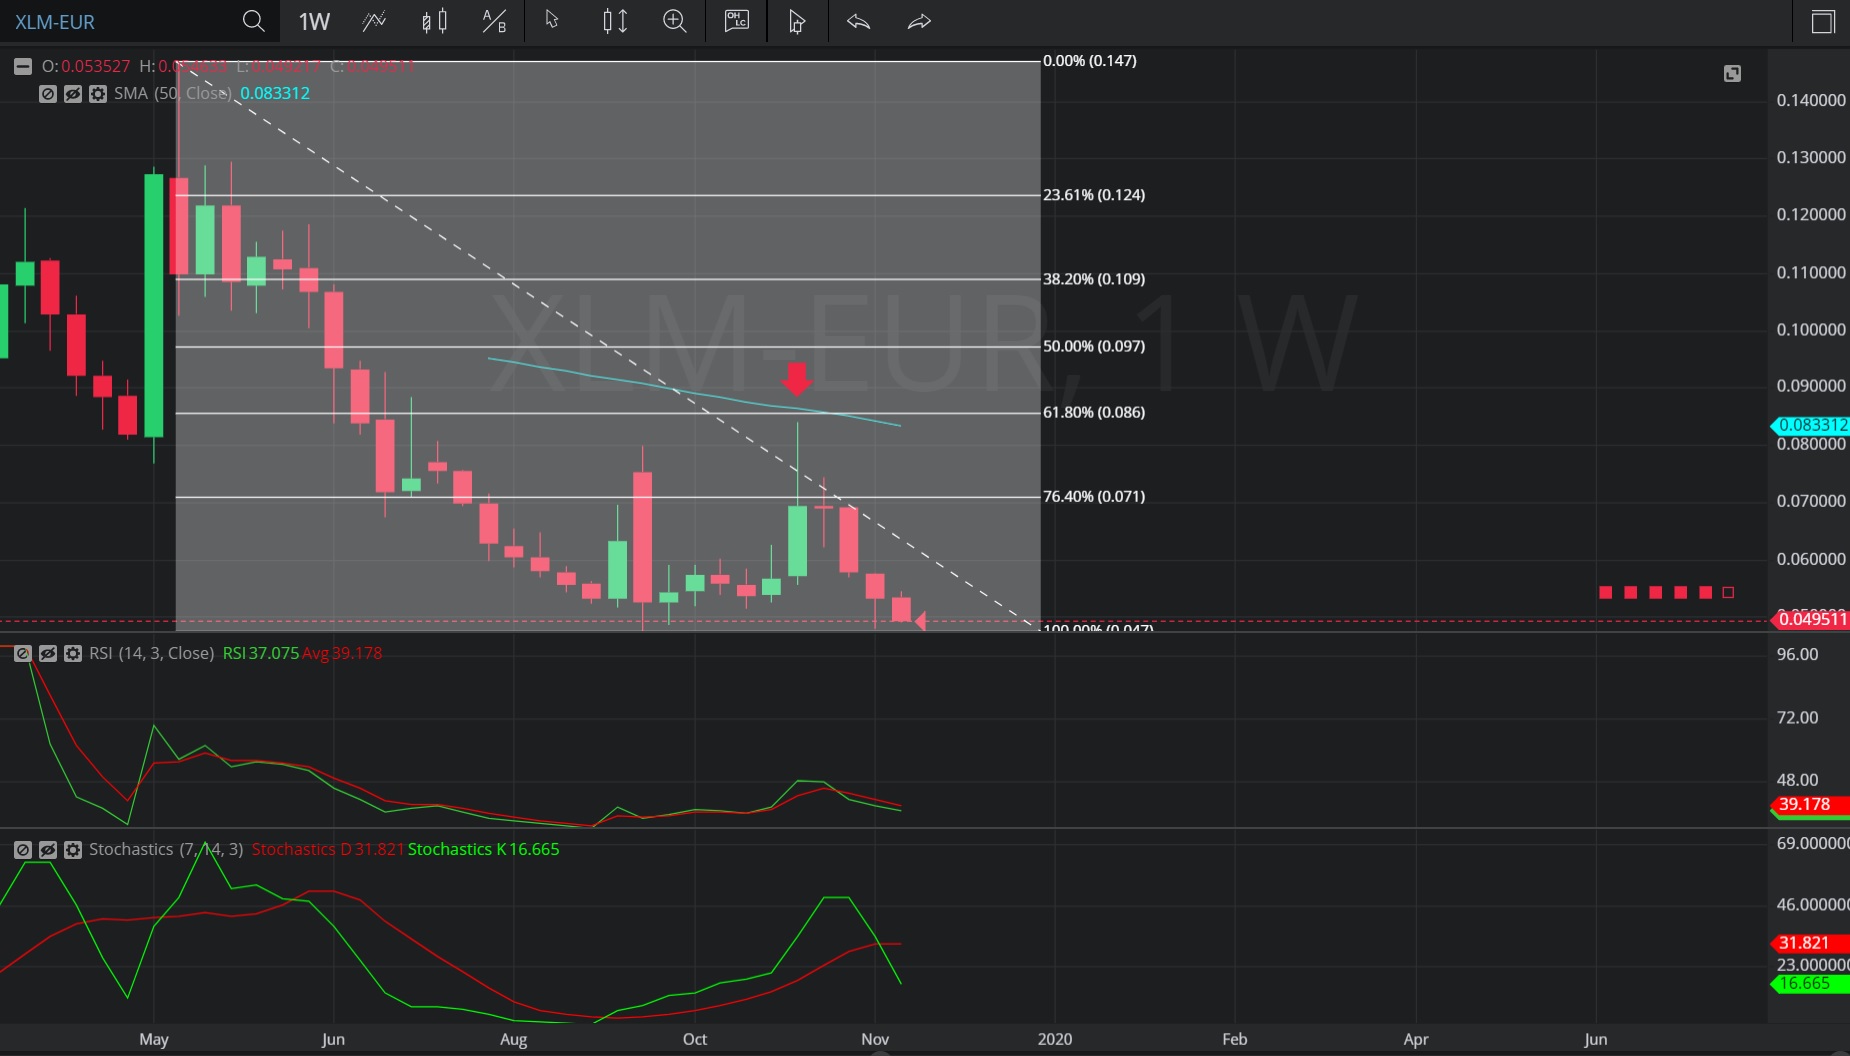
In this Weekly chart of Stellar/ Euro (XLM/ EUR), there is a depreciating range from 0.1466 to 0.047474.
We can see that after the depreciation, the market appreciated to the 0.084210 level (indicated by the red down arrow), just below the 0.08534 level, representing the 38.2% retracement of the depreciating range.
We can see that after the retracement, the market resumed its depreciation and has been mostly capped below the 0.070868 level, representing the 23.6% retracement of the depreciating range.
Using a Simple Moving Average, we can see the market’s appreciation to the 0.084210 level was also just below the 50-bar Simple Moving Average.
Using RSI, we can see that the slope of RSI (14) and RSI Average (3) turned negative after the appreciation to 0.084210, and that RSI Average (3) bearishly crossed above RSI (14). The slopes of both RSI Average (3) and RSI (14) remain negative, indicating further depreciation is likely.
Using Slow Stochastics, we can see the slope of Stochastics K turned negative after the appreciation to 0.084210, and we can see Stochastics D bearishly crossed above Stochastics K, indicating further depreciation is likely.
Stay on top of the cryptocurrency market with CryptoDaily’s trading charts!