29 December 2019 - ETC/ BTC – 15-minute
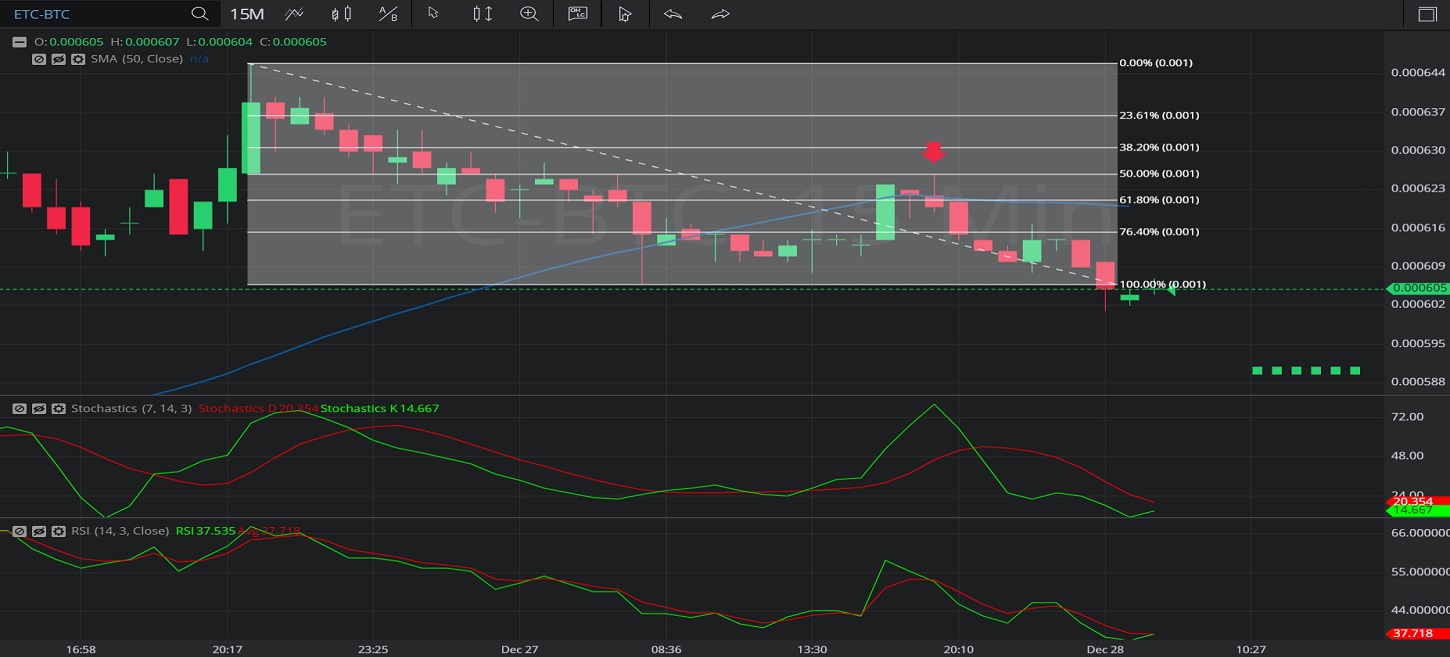
In this 15-minute chart of Ethereum Classic/ Bitcoin (ETC/ BTC), there is a depreciating range from 0.000646 to 0.000606.
We can observe that the market then appreciated to the 0.000626 area (identified by the red down arrow), right around the 50% retracement of the depreciating range.
We can observe that the market was unable to move far above the 50-bar Simple Moving Average during the appreciation higher.
We can also observe the market then extended its recent depreciation.
Using RSI, we can observe the slope of RSI Average (3) became negative after the market traded as high as the 0.000626 level, and that RSI Average (3) bearishly crossed above RSI (14) after the market traded as high as 0.000626. The slope of RSI Average (3) appears to be flattening out and RSI Average (3) is converging with RSI (14), suggesting the depreciation may be losing strength.
Using Slow Stochastics, we can observe that Stochastics K peaked after the market traded at 0.000626 and its slope then became negative. We can also observe that Stochastics D bearishly crossed above Stochastics K after the market traded at 0.000626. Stochastics D remains above Stochastics K and the slope of Stochastics D remains negative. The slope of Stochastics K has turned positive, however, and this may be indicating the depreciation in price is slowing.
Stay on top of the cryptocurrency market with CryptoDaily’s trading charts!
