28 December 2019 - GNT/ USDC – Daily
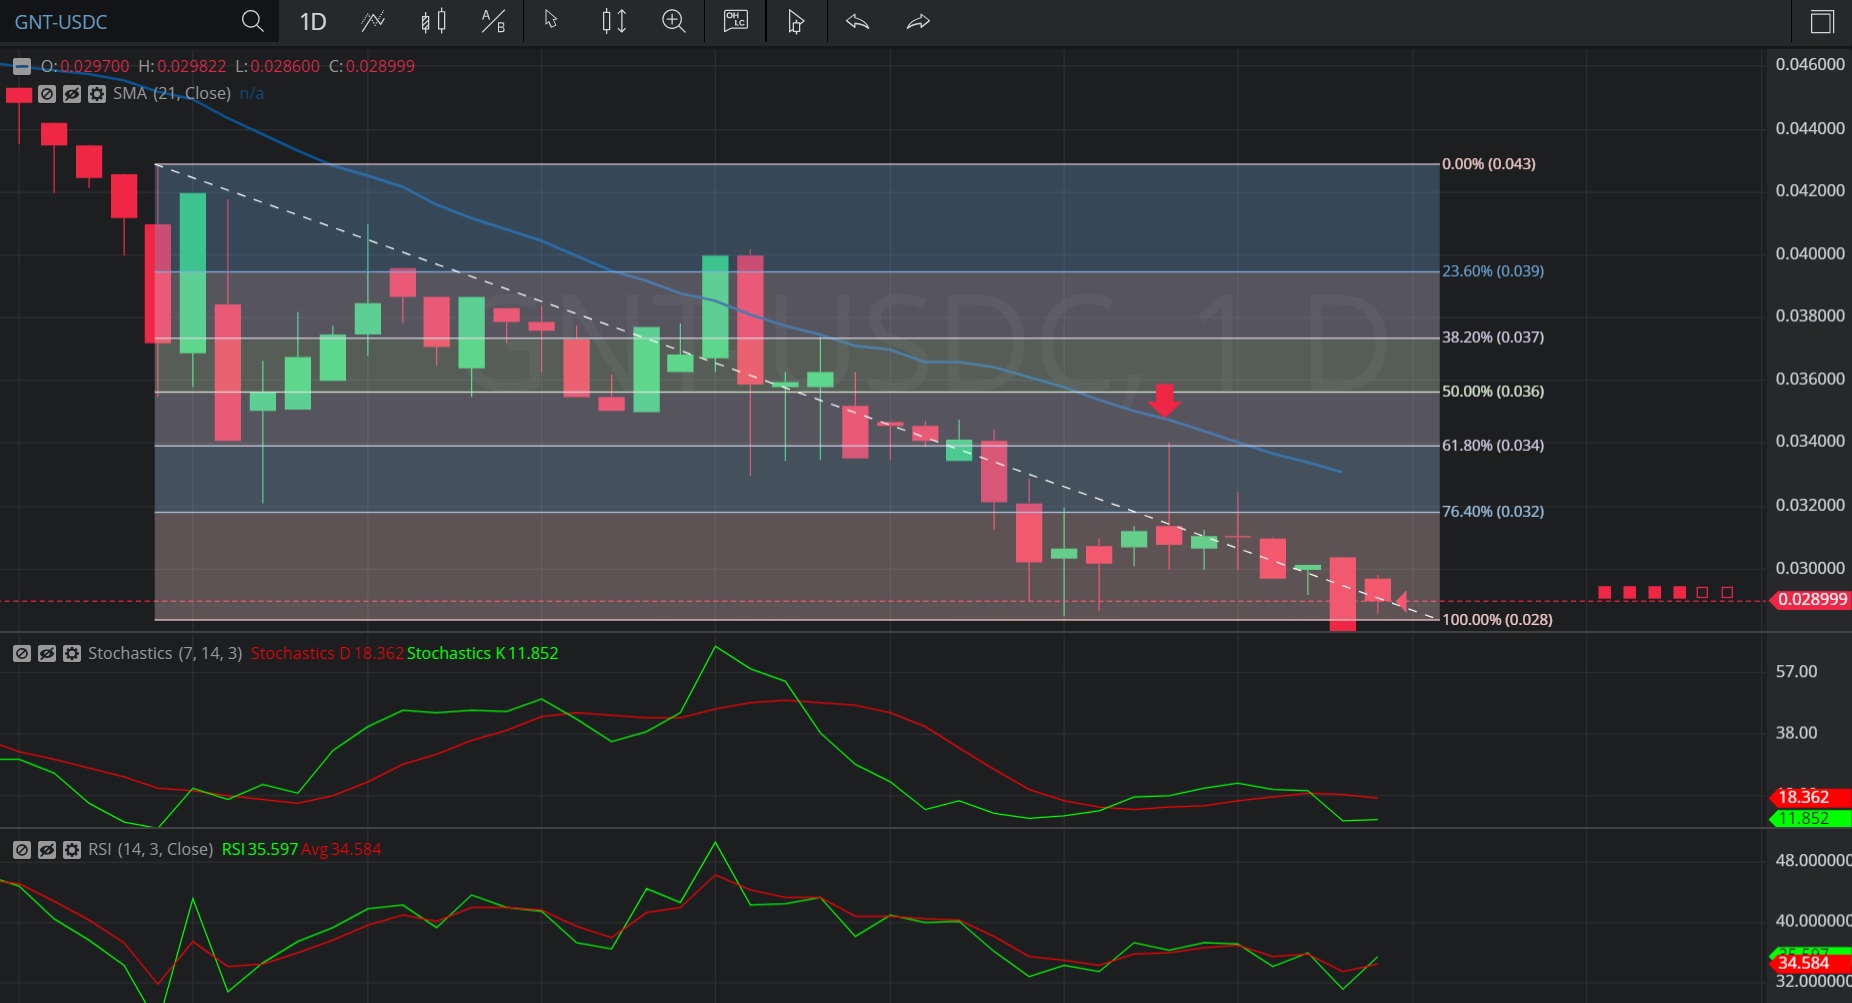
In this Daily chart of Golem/ USD Coin (GNT/ USDC), there is a depreciating range from 0.04285 to 0.028524.
We can observe that the market then moved higher to the 0.034059 area (identified by the red down arrow), just above the 0.033996532 level that represents the 38.2% retracement of the depreciating range.
We can also observe the market then moved lower and continues to depreciate.
Using RSI, we can observe the slope of RSI (14) turned negative after the 0.034059 area was reached. We can also observe the slope of RSI Average (3) has turned negative and that RSI Average (3) bearishly crossed above RSI (14), possibly indicating additional price depreciation.
Using Slow Stochastics, we can observe the slope of Stochastics K turned negative after the 0.034059 area was reached. We can also observe that Stochastics D bearishly moved above Stochastics K and remains above, an indication that price depreciation may continue.
Stay on top of the cryptocurrency market with CryptoDaily’s trading charts!
