26 December 2019 - BAT/ USDC – 15-minute
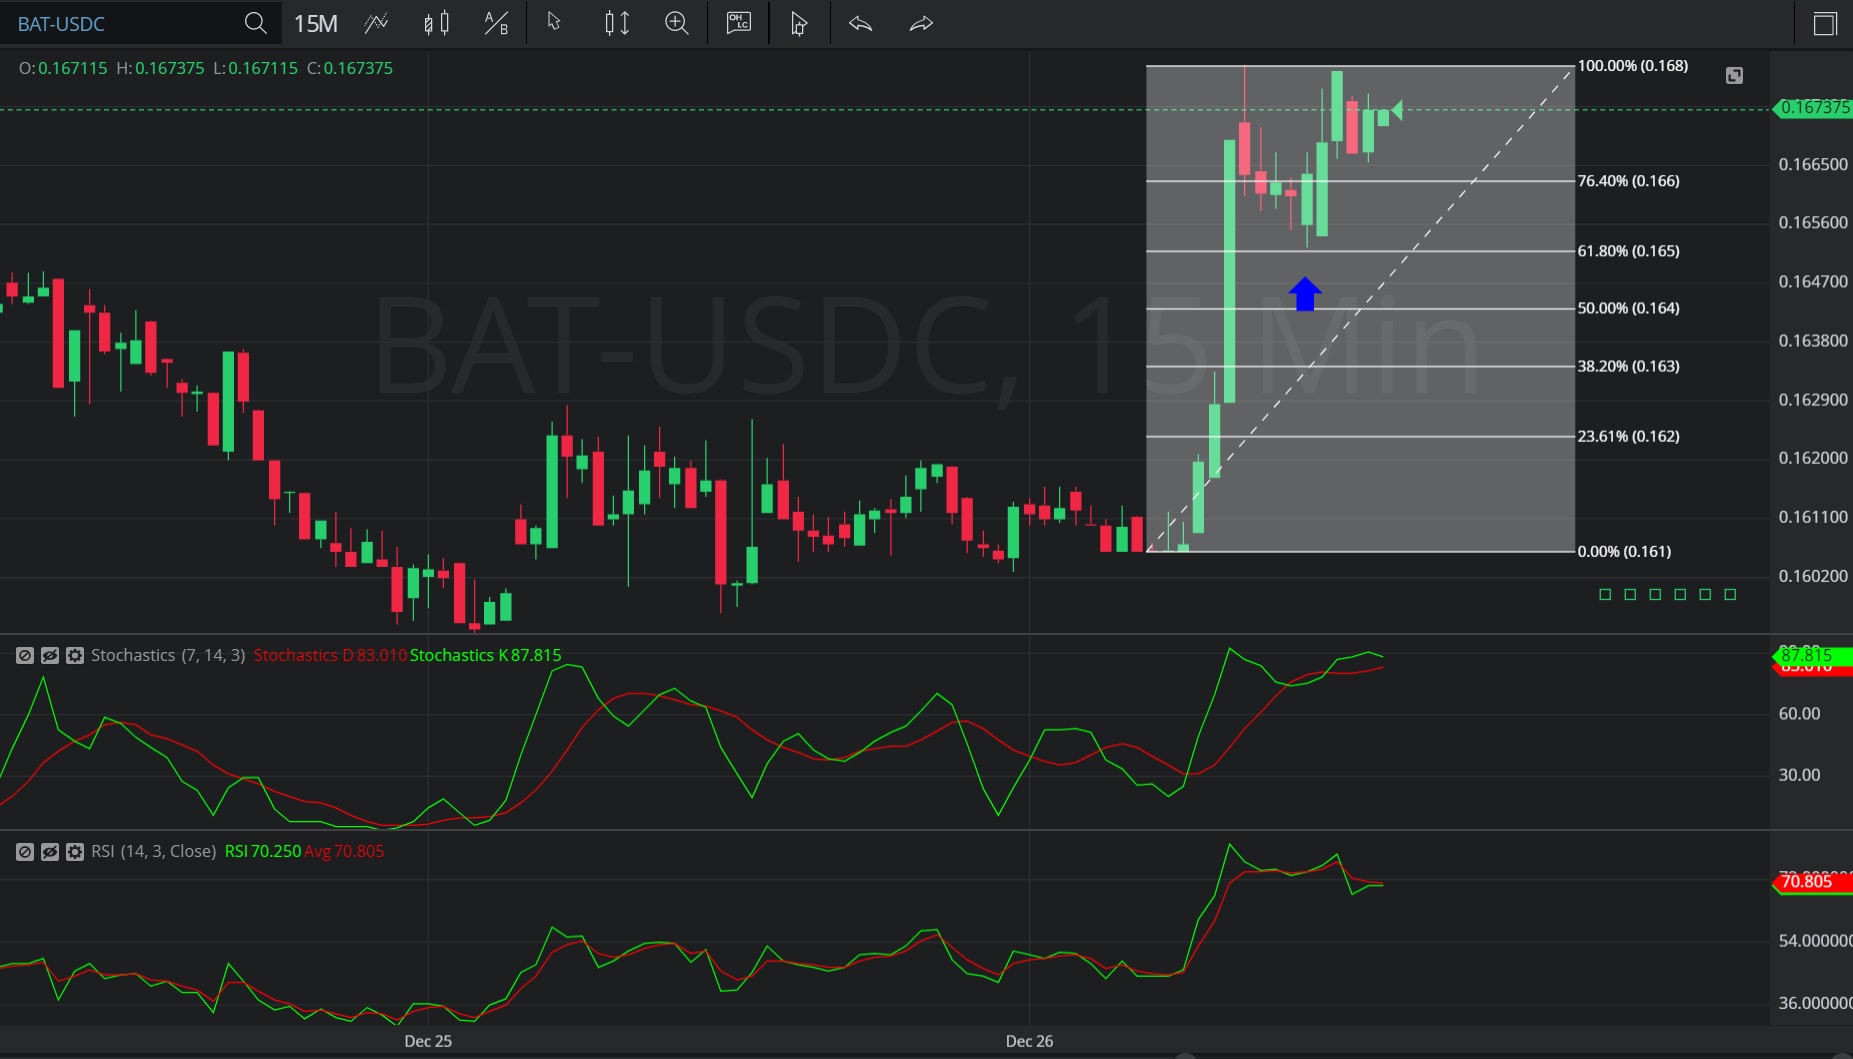
In this 15-minute chart of Basic Attention Token/ USD Coin (BAT/ USDC), there is an appreciating range from 0.1606 to 0.16806.
We can observe the market then depreciated to the 0.165269 level (indicated by the blue up arrow), just above the 0.16521028 area that represents the 38.2% retracement of the appreciating range.
We can observe the market then extended its appreciation further.
Using RSI, we can observe the slope of RSI (14) and RSI Average (3) both became positive after the market traded as low as the 0.165269 level. We can also see that RSI (14) bullishly moved above RSI Average (3), indicating probable price appreciation.
Using Slow Stochastics, we can observe that the slope of Stochastics K remained positive after the market traded as low as the 0.165269 level. We also observe that Stochastics K bullishly moved above Stochastics D after trading as low as the 0.165269 level, indicating probable additional price appreciation. Stochastics K remains above Stochastics D, suggesting there may be additional price gains.
Stay on top of the cryptocurrency market with CryptoDaily’s trading charts!
