20 December 2019 - XTZ/ BTC – 4-hourly
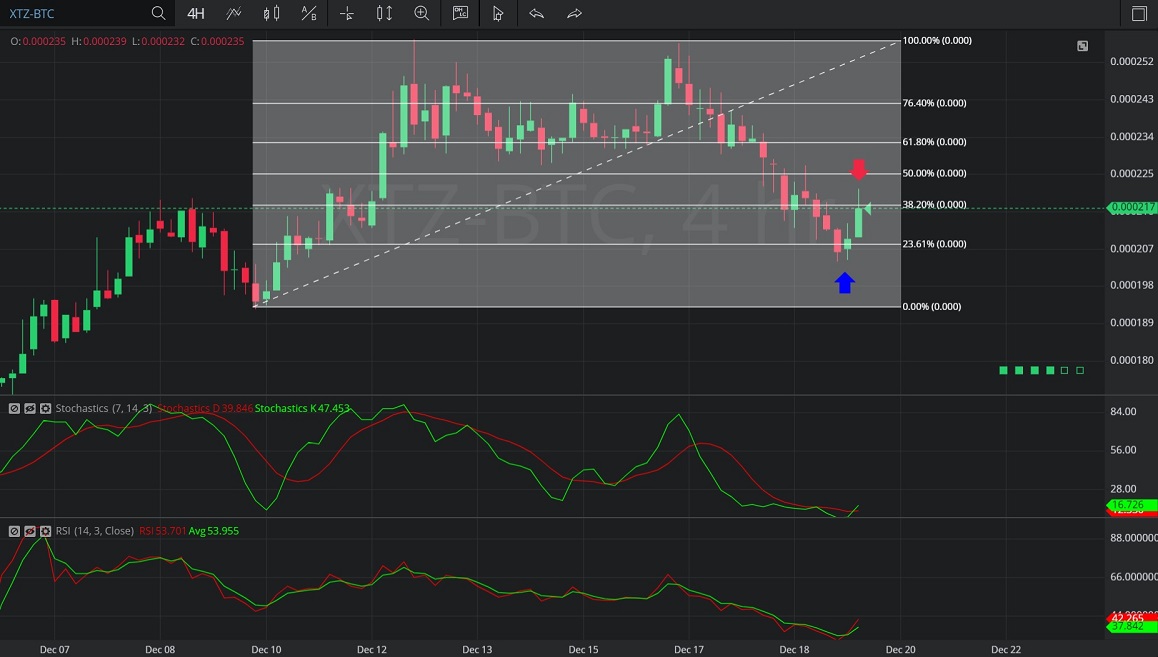
In this 4-hourly chart of Tezos/ Bitcoin (XTZ/ BTC), there is an appreciating range from 0.000193 to 0.000258.
We can see the market then retraced lower, then moved higher to the 0.000257 area, and then depreciated to the 0.000204 level (identified by the blue up arrow).
The 0.000204 area was just below the 0.00020834 level, representing the 76.4% retracement of the appreciating range.
The market then appreciated to the 0.000222 level, above the 0.00021783 area that represents the 61.8% retracement of the appreciating range.
The market has continued to appreciate.
Using RSI, we can observe that RSI (14) bullishly crossed above RSI Average (3) after the market traded as low as the 0.000204 level. We also observe that the slope of RSI (14) remains positive and the slope of RSI Average (3) remains positive, suggesting additional price appreciation may result.
Using Slow Stochastics, we can observe that Stochastics K bullishly crossed above Stochastics D after the market traded as low as the 0.000204 level. We can also observe that the slope of Stochastics K remains positive and the slope of Stochastics D remains positive, suggesting additional price appreciation may result.
Stay on top of the cryptocurrency market with CryptoDaily’s trading charts!
