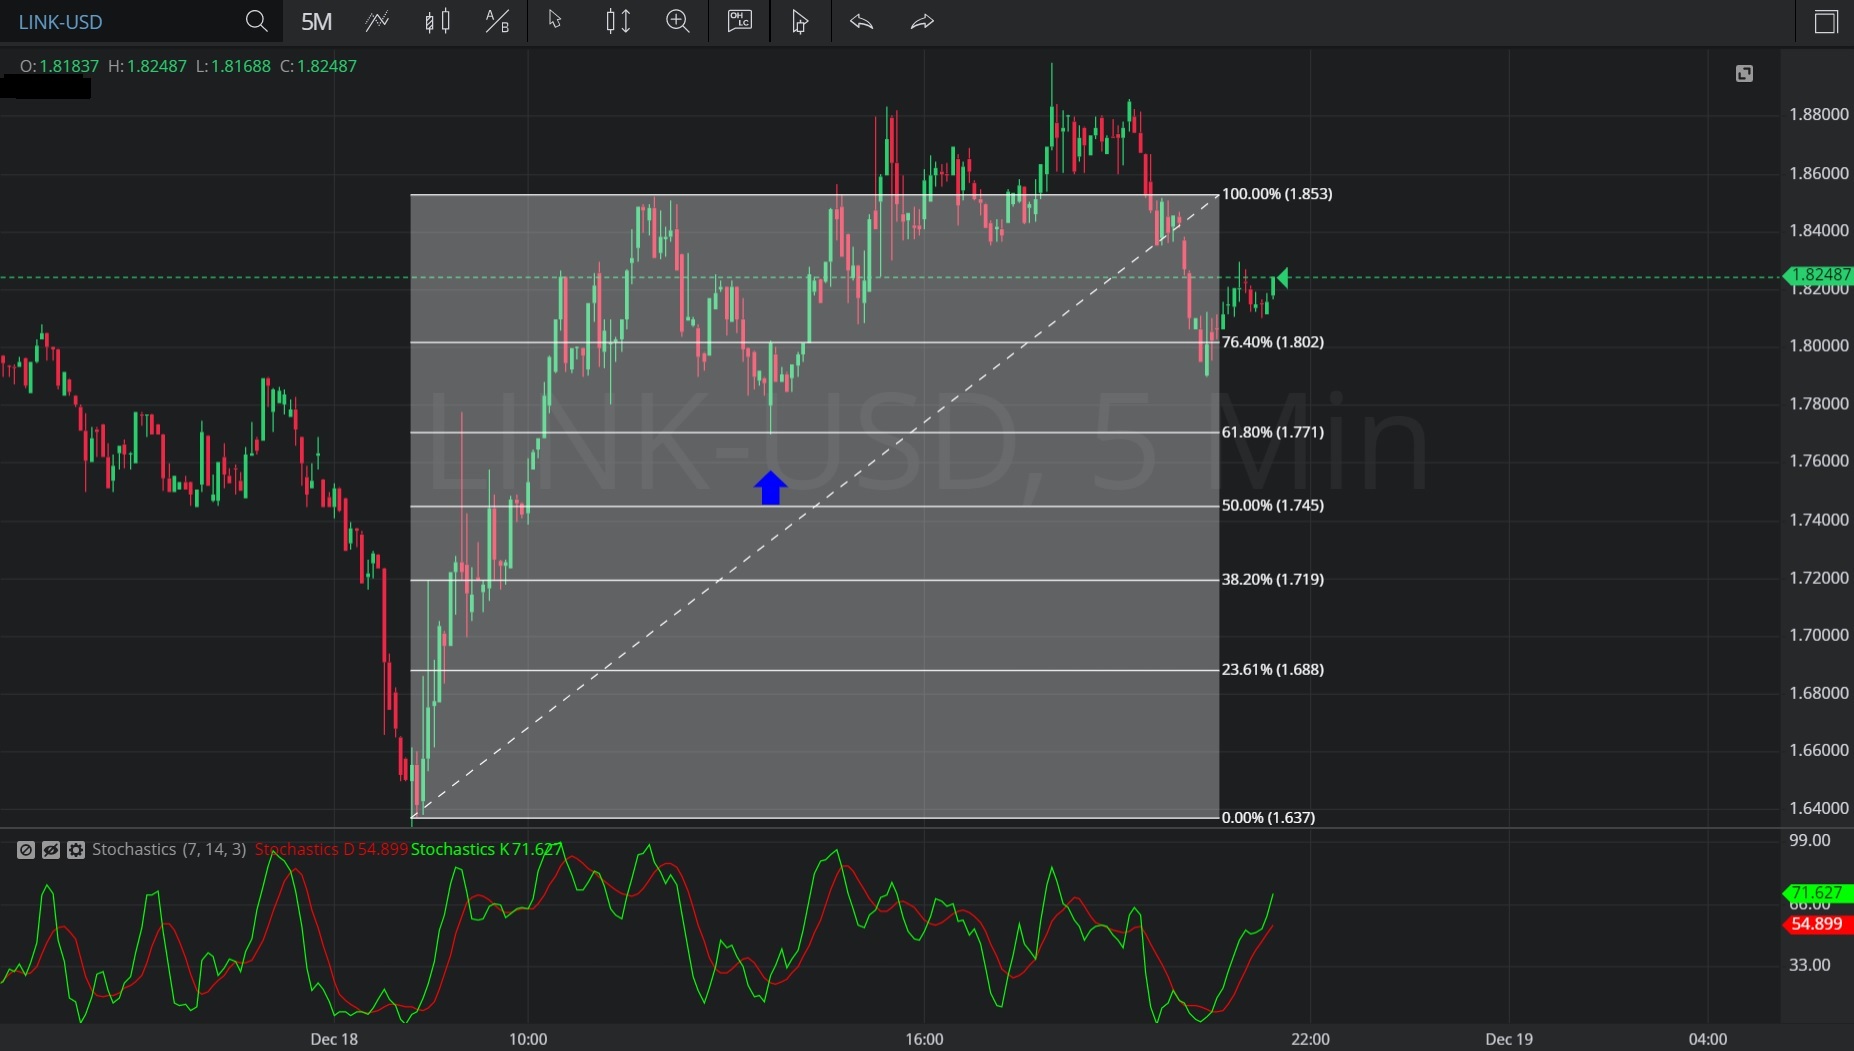
In this 5-minute chart of Chainlink/ United States dollar (LINK/ USD), there is an appreciating range from 1.63363 to 1.8525.
We can see the market then retraced lower to the 1.770 level (indicated by the blue up arrow), just above the 1.76889166 area that represents the 38.2% retracement of the appreciating range.
The market then appreciated to the 1.88361 area, depreciated to the 1.83551 level, and then appreciated to the 1.89882 area before retracing lower to the 1.790 area.
Using Slow Stochastics, we can observe that Stochastics K moved above Stochastics D after the market traded as low as 1.770. We can also observe the slope of Stochastics D remained positive until the market reached a relative high of 1.83960, and turned negative on the 5-minute bar that closed at 1.82849.
Stay on top of the cryptocurrency market with CryptoDaily’s trading charts!