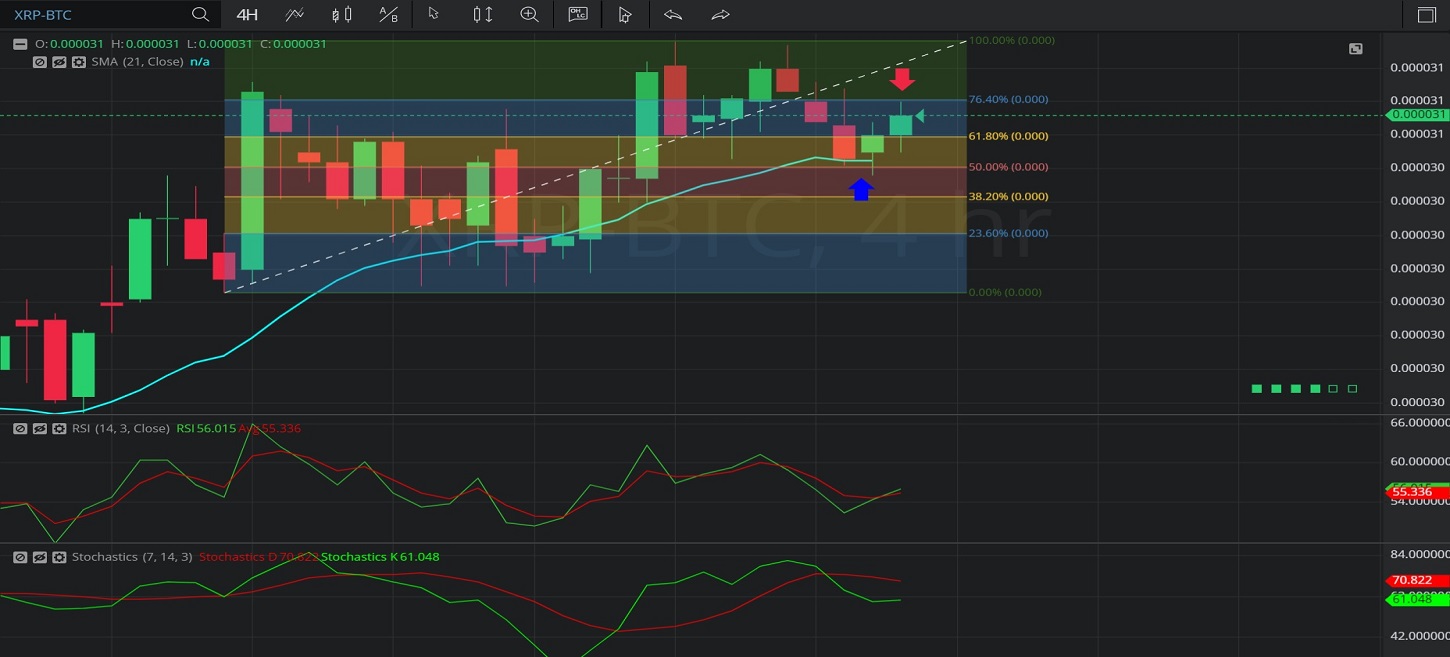
In this 4-hourly chart of Ripple/ Bitcoin (XRP/ BTC), there is an appreciating range from 0.0003007 to 0.00003088.
The market then depreciated to the 0.00003048 level (identified by the blue up arrow), just below the 21-bar Simple Moving Average. This level is also right around the 0.000030475 level, representing the 50% retracement of the appreciating range.
The market then appreciated to the 0.00003070 level (identified by the red down arrow), right around the 0.0000306888 area that represents the 23.6% retracement of the appreciating range.
Using RSI, we can observe the slopes of RSI (14) and RSI Average (3) are both positive and that RSI (14) just bullishly crossed above RSI Average (3), indicating the market’s appreciation may be continuing.
Using Slow Stochastics, we can see that Stochastics K and Stochastics D are bullishly converging and that the slope of Stochastics K has turned positive, indicating the market’s appreciation may be continuing.
Stay on top of the cryptocurrency market with CryptoDaily’s trading charts!