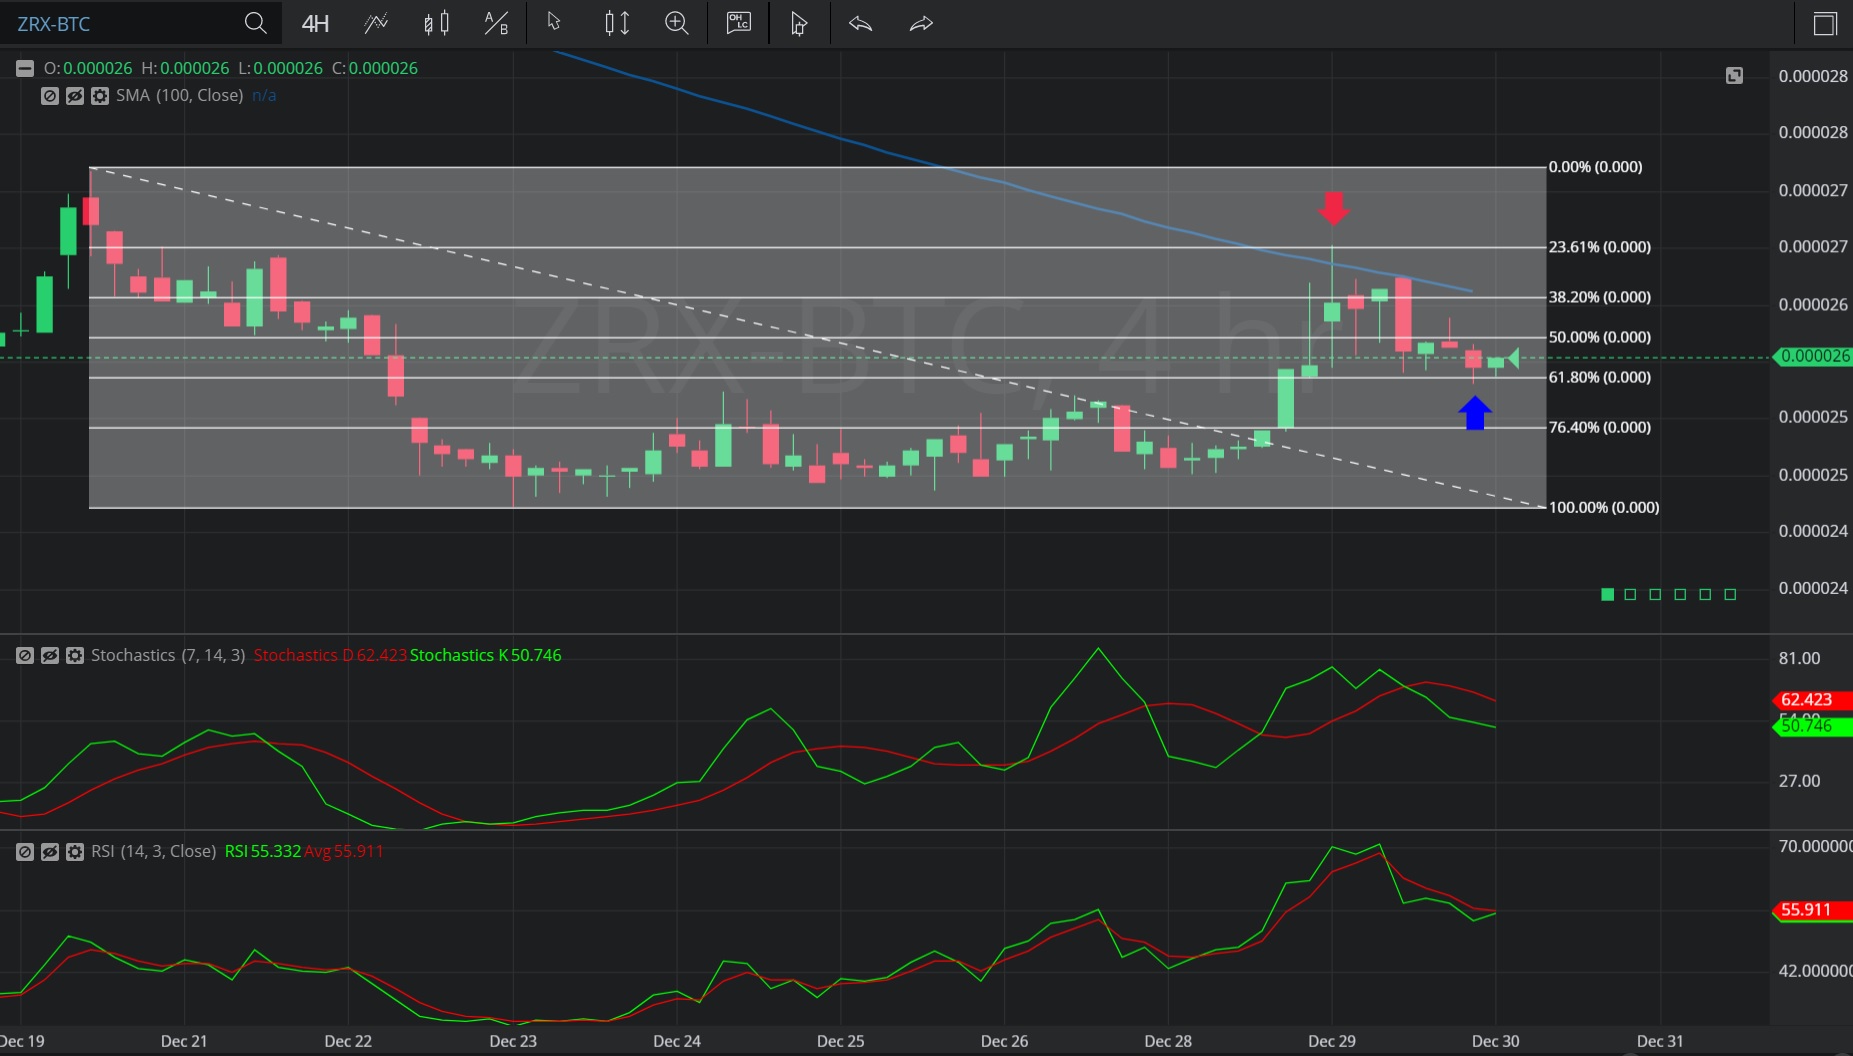
In this 4-hourly chart of 0x/ Bitcoin (ZRX/ BTC), there is a depreciating range from 0.00002768 to 0.00002473.
We can observe that the market then appreciated to the 0.00002703 level (identified by the red down arrow), just above the 0.00002698 area that represents the 76.4% retracement of the depreciating range.
We can observe that the high of 0.00002703 was just above the 100-bar Simple Moving Average.
We can observe that the market then depreciated to the 0.00002581 level (identified by the blue up arrow), just below the 0.00002585 level that represents the 38.2% retracement of the depreciating range.
Using RSI, we can observe that the slopes of both RSI (14) and RSI Average (3) bearishly turned negative after the market traded as high as 0.00002703. We can also observe that RSI Average (3) also bearishly moved above RSI (14) thereafter, suggesting price depreciation. RSI (14) and RSI Average (3) are converging and the slope of RSI (14) has turned positive, suggesting the depreciation in price may be reversing.
Using Slow Stochastics, we can observe that the slopes of both Stochastics K and Stochastics D turned negative after the market traded as high as 0.00002703. We can also observe that Stochastics D bearishly moved above Stochastics K and that Stochastics D remains above Stochastics K, possibly indicating additional price depreciation.
Stay on top of the cryptocurrency market with CryptoDaily’s trading charts!