
Bitcoin (BTC) is struggling to break past the key resistance level of $7,156 as we can see on the 4H chart for BTC/USD. Earlier this week, traders expected a sharp breakout to either side when Bitcoin (BTC) approached a decision point. However, the price started to move sideways instead and has now increased the probability of a bullish breakout now that it has printed a bull flag. If we are going to see a bullish breakout, then the current bull flag is the bull’s best hope. This is a strong resistance level and if the price ends up breaking past it, we can see a rally towards the previous high at $7,452 and potentially pas that.

The reason we question whether this is a bull flag or just another trap is because this is not the only chart we should be looking at. It is true that Bitcoin (BTC) still has plenty of room to rally now that it has entered a bull flag and it has already found support on top of the falling wedge. However, we also need to realize that the bulls are more optimistic than ever despite the near-term fear in the market. The Fear and Greed Index has declined further and is now at 20 again in the region of extreme fear. For contrarian traders and investors this is a sign to go against the herd and be bullish now that everyone is all fearful for now. That being said, every reasonable trader would recognize the long-term risks of being long. The price has yet to decline further to complete this correction regardless of any potential bullish breakout in the near future.
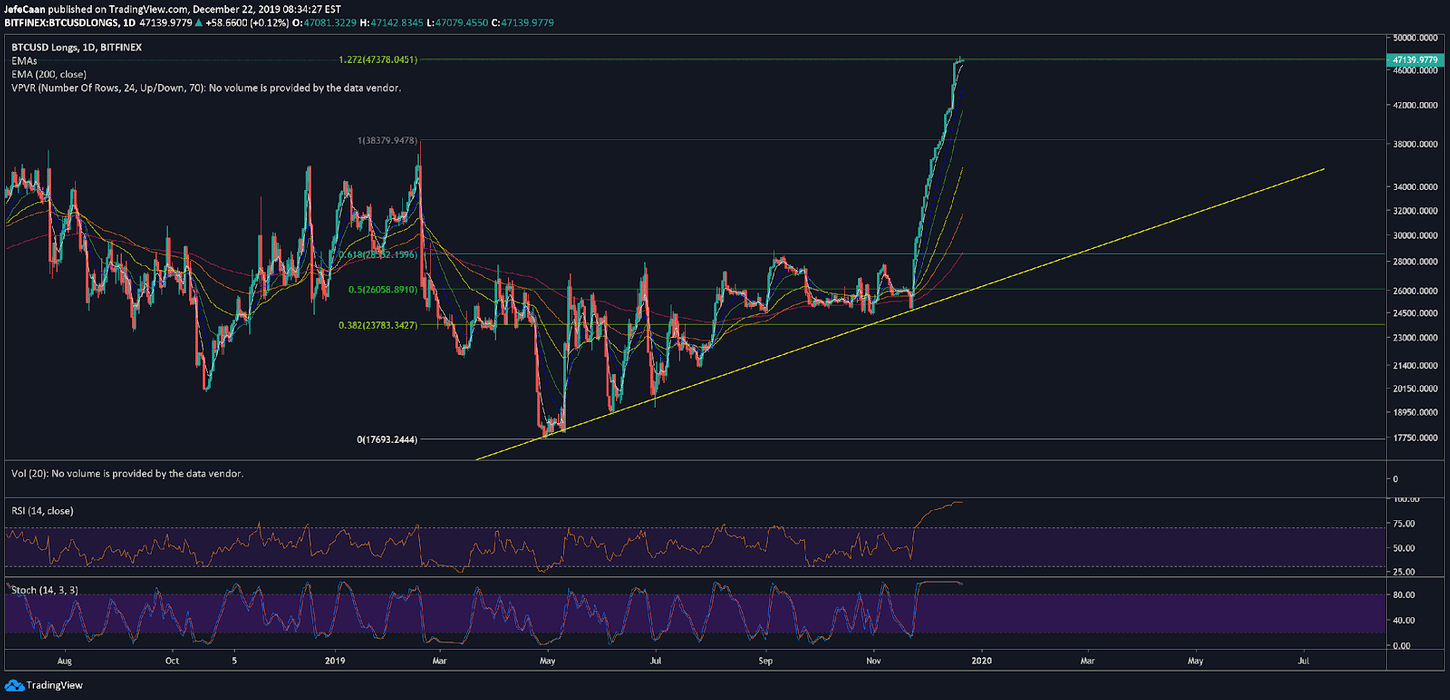
Bitcoin Longs has been surging higher with no signs of any correction. The daily chart for BTCUSDLongs shows the parabolic increase in the number of longs in the past few weeks. However we have now seen BTCUSDLongs reach the 1.272 fib retracement level which means that some sort of a correction can be expected in the near future. If the data from Bitfinex is to be relied on, then this could result in a massive bloodbath if we see a move that liquidates many of such long positions.
The price of Bitcoin (BTC) is at risk of losing a lot more long-term. This could just be the catalyst that might bring about the long-awaited correction. At this point, most traders are already expecting some sort of a leg down to the $6,000 level to test it as support. That is also a level where a very large number of traders would have their stops because $6,000 was a strong psychological support. So, the bull flag that we currently see on the BTC/USD chart does not have to be a trap. It can be what you want it to be. A good trader should be able to not only recognize this as a potential bullish opportunity but also an excellent opportunity to enter short positions when the price next tops out.