Bitcoin
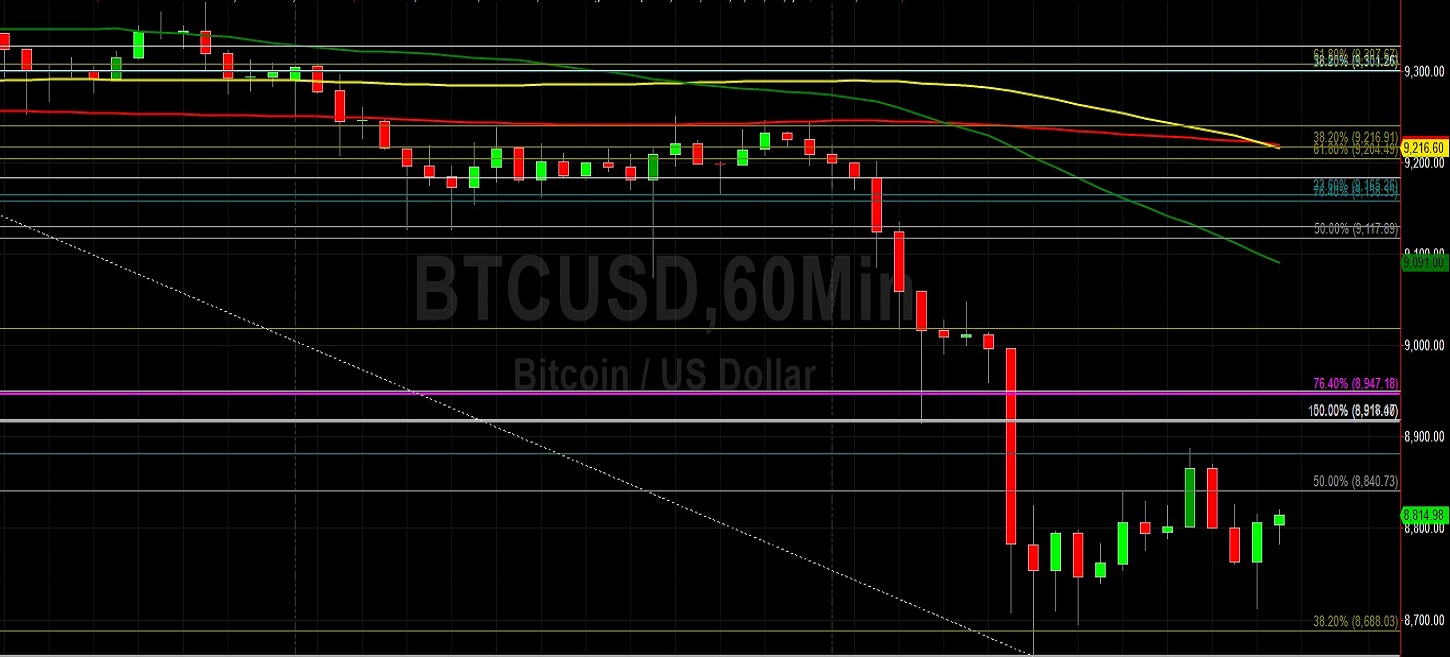
Bitcoin (BTC/USD) extended its recent depreciation early in today’s Asian session as the pair traded as low as the 8712.52 area. Selling pressure commenced during yesterday’s Asian session from the 9244.18 area, knocking BTC/USD lower to the 8915.00 area by the European session. Some short covering took place around that level as it is right around the 50% retracement of the 7296.44 – 10540.49 range. BTC/USD Bears then resumed their intraday carnage, electing Stops below the 8840.73 area, representing the 50% retracement of the 10382.08 – 7299.37 range. Additional Stops were then triggered below the 8688.03 area, representing the 38.2% retracement of the 10939.34 – 7296.44 range, en route to the daily low of 8660.00. This print is the pair’s weakest showing since late October.
Some of the pair’s trading activity continues to be dominated by longer-term trading ranges. In particular, the high following the recent appreciation to the 10540.49 area in late October was 9939.69, a print on 27 October that is right around a relative historic high of 9948.12. The next level of technical Support related to that range is 8338.78. Chartists observe that the pair had orbited the 50-bar MA (4-hourly) for about one week prior to yesterday’s move, and BTC/USD is now trading between the 100-bar MA (4-hourly) and 200-bar MA (4-hourly). Traders are also noting that the 100-bar MA (hourly) has just crossed above the 50-bar MA (hourly) and the 50-bar MA (hourly) has just crossed below the 200-bar MA (hourly), both of which are Bearish developments. Below current market activity, traders anticipate some buying demand between the 8502 level.
Price activity is nearest the 100-bar MA (4-hourly) at 9,007.79 and the 50-bar MA (Hourly) at 9,101.61.
Technical Support is expected around 8502.35/ 8062.04/ 7343.17 with Stops expected below.
Technical Resistance is expected around 9130.00/ 9378.16/ 9774.89 with Stops expected above.
On 4-Hourly chart, SlowK is Bullishly above SlowD while MACD is Bearishly below MACDAverage.
On 60-minute chart, SlowK is Bearishly below SlowD while MACD is Bullishly above MACDAverage.
Ethereum
Ethereum (ETH/USD) appreciated early in today’s Asian session as the pair climbed higher to the 185.86 area after dropping as low as the 180.71 area during yesterday’s North American session. Stops were elected below the 183.33 area during the move lower, representing the 23.6% retracement of the 515.88 – 80.60 range, and additional Stops were triggered below the 181.74 area, representing the 38.2% retracement of the 153.00 – 199.50 range. The reversal higher took place from just below the 100-bar MA (4-hourly), then indicating around the 180.93 area, and this was also right around the 61.8% retracement of the 197.93 – 153.00 range.
Traders had been observing the pair’s gyrations above the 50-bar MA (4-hourly), with recent trading activity above that indicator offering a clue that traders may be encouraged to take another run at the psychologically-important 200.00 figure, just above the pair’s recent high of 199.50. Even though the pair is now trading below the 50-bar MA (4-hourly), technicians are still encouraged by the fact the 100-bar MA (4-hourly) just crossed above the 200-bar MA (4-hourly). ETH/USD evidenced some strength this week when it traded around the 194.60 area after Stops were elected above the 193.45 area, representing the 76.4% retracement of the 199.50 – 173.86 range. The shorter-term outlook for the pair remains cloudy and the pair had tested its 200-bar MA (hourly) at least three times during recent trading sessions before moving below during yesterday’s price activity. Traders anticipate some buying pressure around the 178.40 area.
Price activity is nearest the 50-bar MA (4-hourly) at 184.99 and the 200-bar MA (Hourly) at 185.06.
Technical Support is expected around 180.43/ 177.39/ 175.02 with Stops expected below.
Technical Resistance is expected around 187.66/ 191.32/ 194.60 with Stops expected above.
On 4-Hourly chart, SlowK is Bullishly above SlowD while MACD is Bearishly below MACDAverage.
On 60-minute chart, SlowK is Bearishly below SlowD while MACD is Bullishly above MACDAverage.