Bitcoin
Bitcoin (BTC/USD) was quite volatile early in today’s Asian session as the pair depreciated to the 9075.00 level before rocketing higher to the 9250.82 area. Traders observed some very technical trading during yesterday’s Asian and European sessions as the pair traded higher to the 9375.16 area, right around the 61.8% retracement of the 6815.28 – 13868.44 range. Selling pressure then commenced and knocked the pair lower to the 9123.22 area, right around the 50% retracement of the 10944.67 – 7301.77 range. Traders pushed the pair below the 50-bar MA (4-hourly) during the move lower.
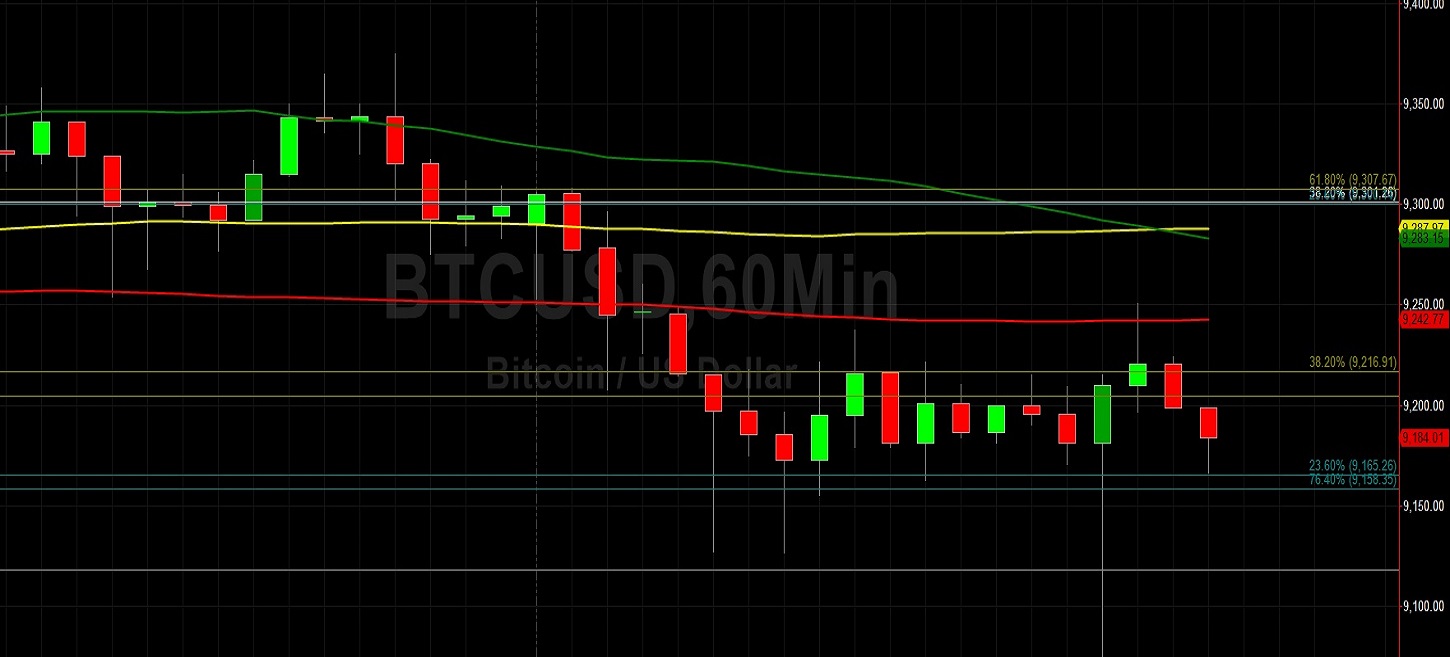
The pair’s move lower has definitely shifted market sentiment to the bearish side, as the depreciation also coincided with a move below the 50-bar MA (hourly), 100-bar MA (hourly), and 200-bar MA (hourly). Below current market activity, technicians are observing the 8947.18 area as an important level, representing the 76.4% retracement of the 7427.00 – 13868.44 range. The 200-bar MA (4-hourly) is currently indicating just below this level, and this could provide some technical Support to BTC/USD. Thereafter, the 8847.43 area remains a significant level.
Price activity is nearest the 50-bar MA (4-hourly) at 9,244.05 and the 200-bar MA (Hourly) at 9,242.71.
Technical Support is expected around 8918.47/ 8535.67/ 8062.04 with Stops expected below.
Technical Resistance is expected around 9774.89/ 10540.49/ 10939.34 with Stops expected above.
On 4-Hourly chart, SlowK is Bullishly above SlowD while MACD is Bearishly below MACDAverage.
On 60-minute chart, SlowK is Bearishly below SlowD while MACD is Bullishly above MACDAverage.
Ethereum
Ethereum (ETH/USD) was volatile early in today’s Asian session as the pair weakened to the 184.14 level and then appreciated to the 187.43 area before softening. Selling pressure began in earnest during yesterday’s Asian session when ETH/USD Bears hit the market around the 192.27 area and pushed the pair below the 189.05 area. Selling pressure intensified as the pair came off below the 187.15 area, representing the 23.6% retracement of the 152.11 – 197.97 range. Some Stops were elected below the 185.47 area, representing the 38.2% retracement of the 239.45 – 152.11 range.
Buying pressure finally materialised just above the 50-bar MA (4-hourly), then indicating around the 184.77 area during the European session. Notably, that buying pressure also coincided with the 200-bar MA (hourly). The market bias of ETH/USD remains mixed at present as the pair is orbiting the 100-bar MA (hourly), currently above the 200-bar MA (hourly) and below the 50-bar MA (hourly). One range that traders are watching is the 122.75 – 364.49 range, as the 179.80 area represents the 76.4% retracement of that move.
Price activity is nearest the 50-bar MA (4-hourly) at 184.75 and the 100-bar MA (Hourly) at 187.21.
Technical Support is expected around 183.33/ 181.74/ 177.39 with Stops expected below.
Technical Resistance is expected around 194.60/ 197.93/ 199.50 with Stops expected above.
On 4-Hourly chart, SlowK is Bearishly below SlowD while MACD is Bearishly below MACDAverage.
On 60-minute chart, SlowK is Bullishly above SlowD while MACD is Bullishly above MACDAverage.