Bitcoin
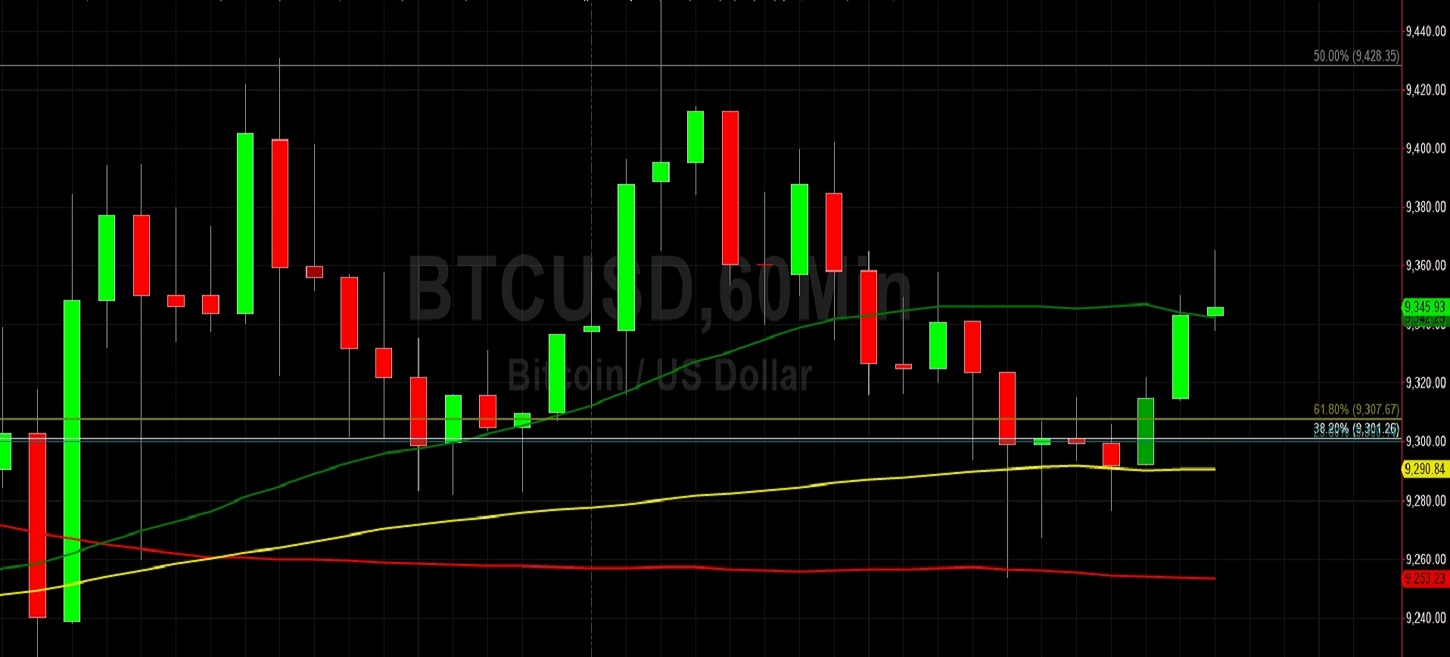
Bitcoin (BTC/USD) appreciated to the 9364.95 area early in today’s Asian session as the pair appreciated from the 9253.66 level late in yesterday’s North American session, then right around the 200-bar MA (hourly). Traders continue to search for a market bias as the pair continues to orbit the 9301.26 area, representing the 38.2% retracement of the 7296.44 – 10540.49 range. That area is also near another important retracement level, namely the 9269.57 level that represents the 50% retracement of the broader 4670.69 – 13868.44 range. Below current market activity, the next retracement level related to this broader range is the 8184.23 area. Above current market activity, the next retracement level related to this broader range is the 10354.90 area.
Longer-term BTC/USD traders also observe that current market activity is also orbiting the 9385.99 area, the 61.8% retracement level of another range, specifically the move from 6615.28 to 13868.44. Below that level, the 8327.03 area represents the 76.4% retracement of that range and may provide technical Support. Above that level, the 10241.86 area represents the 50% retracement of that range and may provide technical Resistance. A couple of additional important levels to monitor include the 8947.18 and 9887.63 areas, representing the 76.4% and 61.8% retracements of the 7427.00 – 13868.44 range.
Price activity is nearest the 50-bar MA (4-hourly) at 9,245.74 and the 50-bar MA (Hourly) at 9,342.67.
Technical Support is expected around 8918.47/ 8535.67/ 8062.04 with Stops expected below.
Technical Resistance is expected around 9774.89/ 10540.49/ 10939.34 with Stops expected above.
On 4-Hourly chart, SlowK is Bearishly below SlowD while MACD is Bearishly below MACDAverage.
On 60-minute chart, SlowK is Bullishly above SlowD while MACD is Bearishly below MACDAverage.
Ethereum
Ethereum (ETH/USD) appreciated early in today’s Asian session as traders lifted the pair to the 192.28 area following Bids that emerged during the 188.24 area after depreciating from the 194.60 area during yesterday’s European session. Traders continue to evaluate market sentiment as the pair inches closer to the psychologically-important 200.00 figure. ETH/USD’s recent gyrations have factored in some longer-term price ranges that are impacting market activity, including the 191.40 area that represents the 23.6% retracement of the 318.60 – 152.11 range. If traders are able to take out the recent 199.50 high and absorb the psychologically-important 200.00 figure, attention will again focus on the 202.23 area, representing the 23.6% retracement of the broader 364.49 – 152.11 range.
Before ETH/USD is able to test those areas, it must first challenge the 197.56 area, representing the 76.4% retracement of the important 146.00 – 364.49 range. Another very important broader range is the 122.75 – 364.49 range, and the 179.80 area represents the 76.4% retracement of that range, with the 215.09 area representing the 61.8% retracement of that range. Longer-term ETH/USD traders and market technicians are also keeping tabs on the much broader 100.15 – 364.49 range, where the 201.10 and 162.52 areas represent the 61.8% and 76.4% retracements.
Price activity is nearest the 50-bar MA (4-hourly) at 184.81 and the 50-bar MA (Hourly) at 188.93.
Technical Support is expected around 186.00/ 183.33/ 177.39 with Stops expected below.
Technical Resistance is expected around 194.60/ 197.93/ 199.50 with Stops expected above.
On 4-Hourly chart, SlowK is Bearishly below SlowD while MACD is Bullishly above MACDAverage.
On 60-minute chart, SlowK is Bullishly above SlowD while MACD is Bearishly below MACDAverage.