Bitcoin
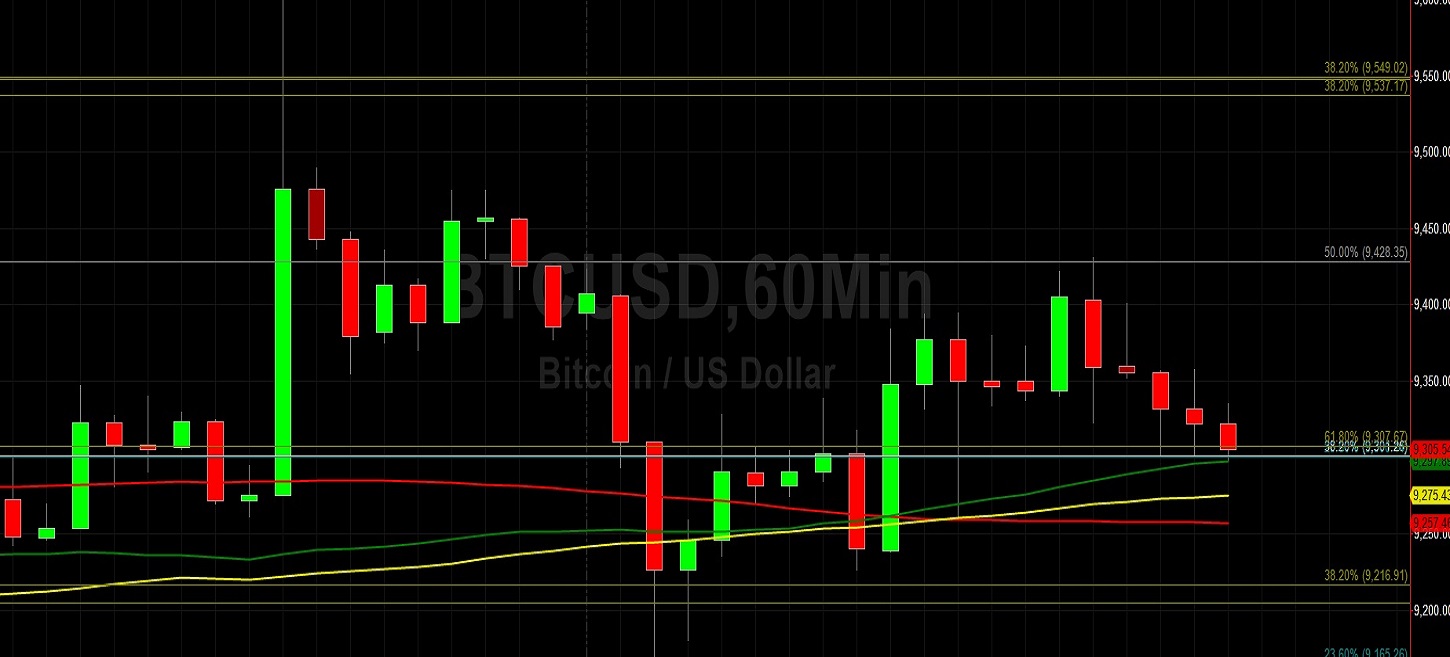
Bitcoin (BTC/USD) moved lower early in today’s Asian session as the pair weakened to the 9301.39 area after trading as high as the 9430.74 area during yesterday’s North American session and as low as the 9169.84 area during yesterday’s European session. The pair appears to have retained at least a little bit of the improved sentiment from earlier this week that saw the pair appreciate to the 9600.00 area, its strongest print since 28 October. Bids emerged around the 9165.26 area during the pair’s pullback, right around the 23.6% retracement of the 13868.44 – 7712.45 range. Just below that level, the 9158.35 level represents the 76.4% retracement of the 8917.00 – 9939.69 range.
BTC/USD continues to orbit the 50-bar MA (4-hourly) and is trading well above the 100-bar MA (4-hourly) and 200-bar MA (4-hourly). Chartists are observing that the 50-bar MA (hourly), 100-bar MA (hourly), and 200-bar MA (hourly) recently converged and are now starting to diverge, an indication that traders may have some fresh market sentiment. If market bias weakens, traders are observing some possible buying pressure around the 8947.18 level, representing the 76.4% retracement of the 7427.00 – 13868.44 range. If market bias strengthens, traders anticipate some potential selling pressure around the 9698.34 area.
Price activity is nearest the 50-bar MA (4-hourly) at 9,248.72 and the 50-bar MA (Hourly) at 9,298.00.
Technical Support is expected around 8918.47/ 8535.67/ 8062.04 with Stops expected below.
Technical Resistance is expected around 9774.89/ 10540.49/ 10939.34 with Stops expected above.
On 4-Hourly chart, SlowK is Bullishly above SlowD while MACD is Bullishly above MACDAverage.
On 60-minute chart, SlowK is Bearishly below SlowD while MACD is Bearishly below MACDAverage.
Ethereum
Ethereum (ETH/USD) weakened early in today’s Asian session as traders knocked the pair lower to the 188.61 area after the pair traded as high as the 192.47 area during yesterday’s North American session. The pair continues to orbit the 186.68 area, an important level that represents the 50% retracement of the 199.50 – 173.86 range. Traders managed to push the pair above the 189.50 area, representing the 61.8% retracement of the 199.50 – 173.86 range, and market activity has derived technical Support around and above the 200-bar MA (4-hourly).
During yesterday’s European session, Bids emerged around the 181.76 area, right around the 38.2% retracement of the 153.00 – 199.50 range. Chartists are observing that the 50-bar MA (hourly) has just crossed above the 200-bar MA (hourly), a bullish technical development that could lead to additional price appreciation. Below current market activity, traders anticipate some possible buying pressure between the 175.02 and 176.25 areas, and continue to note that the 172.88 area represents the 38.2% retracement of the 322.16 – 80.60 range. Above current market activity, traders anticipate some possible selling pressure around the 193.45 and 197.93 levels.
Price activity is nearest the 50-bar MA (4-hourly) at 184.08 and the 50-bar MA (Hourly) at 185.72.
Technical Support is expected around 177.39/ 175.04/ 169.63 with Stops expected below.
Technical Resistance is expected around 193.41/ 197.93/ 199.50 with Stops expected above.
On 4-Hourly chart, SlowK is Bullishly above SlowD while MACD is Bullishly above MACDAverage.
On 60-minute chart, SlowK is Bearishly below SlowD while MACD is Bearishly below MACDAverage.