Bitcoin
Bitcoin (BTC/USD) was weaker early in today’s Asian session as the pair traded as low as the 9068.30 area after some Stops were elected below the 9123.22 area. Traders are observing divergences between the 50-bar MA (hourly), 100-bar MA (hourly), and 200-bar MA (hourly) and this signals that market sentiment may be shifting. The pair had recently been trading above the 50-bar MA (4-hourly) but BTC/USD tested this indicator yesterday and moved below. The pair also had been circling the 9301.26 area, a level that represents the 38.2% retracement of the 7296.44 – 10540.49 range.
If BTC/USD Bulls are able to establish a constructive base around the 9301 area, traders may be able to target the 9774.89 area, representing the 23.6% retracement of the aforementioned range. If BTC/USD Bears take the lead, traders may target levels including the 8918.47, 8535.67, and 8062.04 areas, representing the 50%, 61.8%, and 76.4% retracement levels of the same range. Also, chartists are observing a couple of additional areas of potential technical Support. The 8847.43 area represents the 23.6% retracement of the 13868.44 – 7296.44 range and the 8690.30 area represents the 23.6% retracement of the 13202.63 – 7296.44 range.
Price activity is nearest the 50-bar MA (4-hourly) at 9,271.86 and the 100-bar MA (Hourly) at 9,206.11.
Technical Support is expected around 8918.47/ 8535.67/ 8062.04 with Stops expected below.
Technical Resistance is expected around 9774.89/ 10540.49/ 10939.34 with Stops expected above.
On 4-Hourly chart, SlowK is Bearishly below SlowD while MACD is Bearishly below MACDAverage.
On 60-minute chart, SlowK is Bearishly below SlowD while MACD is Bearishly below MACDAverage.
Ethereum
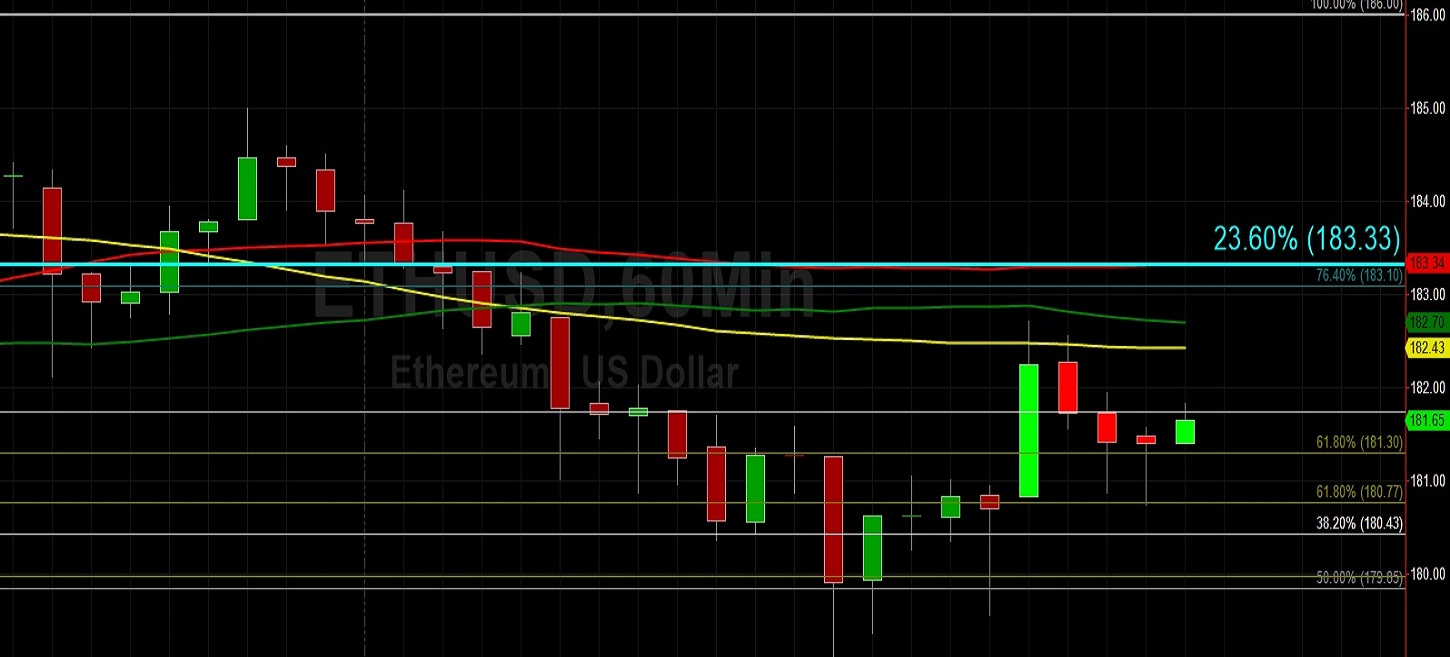
Ethereum (ETH/USD) improved to the 182.72 level early in today’s Asian session after trading as low as the 179.11 area late in yesterday’s North American session. Traders continue to wait for indications that the pair is moving away from key technical levels including the 183.33 area, representing the 23.6% retracement of the 515.88 – 80.60 range. Notably, the areas around the 200-bar MA (4-hourly) have been supportive over recent trading sessions and the pair continues to orbit the 50-bar MA (4-hourly). Some bearish developments may be taking place as the 200-bar MA (hourly) has recently crossed above the 50-bar MA (hourly) and 100-bar MA (hourly).
If ETH/USD Bulls are able to push the market higher, traders will pay very close attention to the 191.40 area, representing the 23.6% retracement of the 318.60 – 152.11 range. Before that level, though, traders will pay attention to price activity around the 185.47 area, representing the 38.2% retracement of the 239.45 – 152.11 range. If ETH/USD Bears take charge, traders will pay close attention to price activity around the 172.72 area, representing the 23.6% retracement of the 239.45 – 152.11 range. Below that area, trades anticipate some buying pressure around the 169.24 area.
Price activity is nearest the 50-bar MA (4-hourly) at 183.26 and the 100-bar MA (Hourly) at 182.43.
Technical Support is expected around 177.39/ 175.04/ 169.63 with Stops expected below.
Technical Resistance is expected around 191.40/ 193.41/ 199.50 with Stops expected above.
On 4-Hourly chart, SlowK is Bearishly below SlowD while MACD is Bearishly below MACDAverage.
On 60-minute chart, SlowK is Bearishly below SlowD while MACD is Bullishly above MACDAverage.