Bitcoin
Bitcoin (BTC/USD) gained ground early in today’s Asian session as the pair traded as high as the 8832.19 area after finding bids around the 8719.52 area during yesterday’s North American session. Traders continue to adjust to the risk of a weaker BTC/USD following its collapse below the 9000 figure during Friday’s European session. Traders were unable to push the pair above the 50-bar MA (4-hourly) prior to the depreciation, and then sizable Stops were elected below the 100-bar MA (4-hourly) during the decline. Traders lacked the conviction to test the 200-bar MA (4-hourly) during the move lower. At the same time, however, price activity tumbled below the 50-bar MA (hourly), 100-bar MA (hourly), and 200-bar MA (hourly).
BTC/USD’s low of 8660.00 during the tumble was also around the 38.2% retracement of the 10939.34 – 7296.44 range. Below that level, traders anticipate some buying pressure between the 8476 – 8535 levels. Chartists are observing the 8338.78 area as a major downside price objective, representing the 76.4% retracement of the move from 9948.12 to 3128.89. Traders also note some possible buying pressure ahead of the 8488.00 level. Above current market activity, traders are focused on some new areas of technical Resistance including the 8881.84, 9019.08, and 9130.00 levels. The technical relevance of the 8881.84 area was already established following BTC/USD’s multiple tests of it after the depreciation.
Price activity is nearest the 200-bar MA (4-hourly) at 8,627.39 and the 50-bar MA (Hourly) at 8,894.62.
Technical Support is expected around 8502.35/ 8062.04/ 7343.17 with Stops expected below.
Technical Resistance is expected around 9130.00/ 9378.16/ 9774.89 with Stops expected above.
On 4-Hourly chart, SlowK is Bearishly below SlowD while MACD is Bearishly below MACDAverage.
On 60-minute chart, SlowK is Bullishly above SlowD while MACD is Bullishly above MACDAverage.
Ethereum
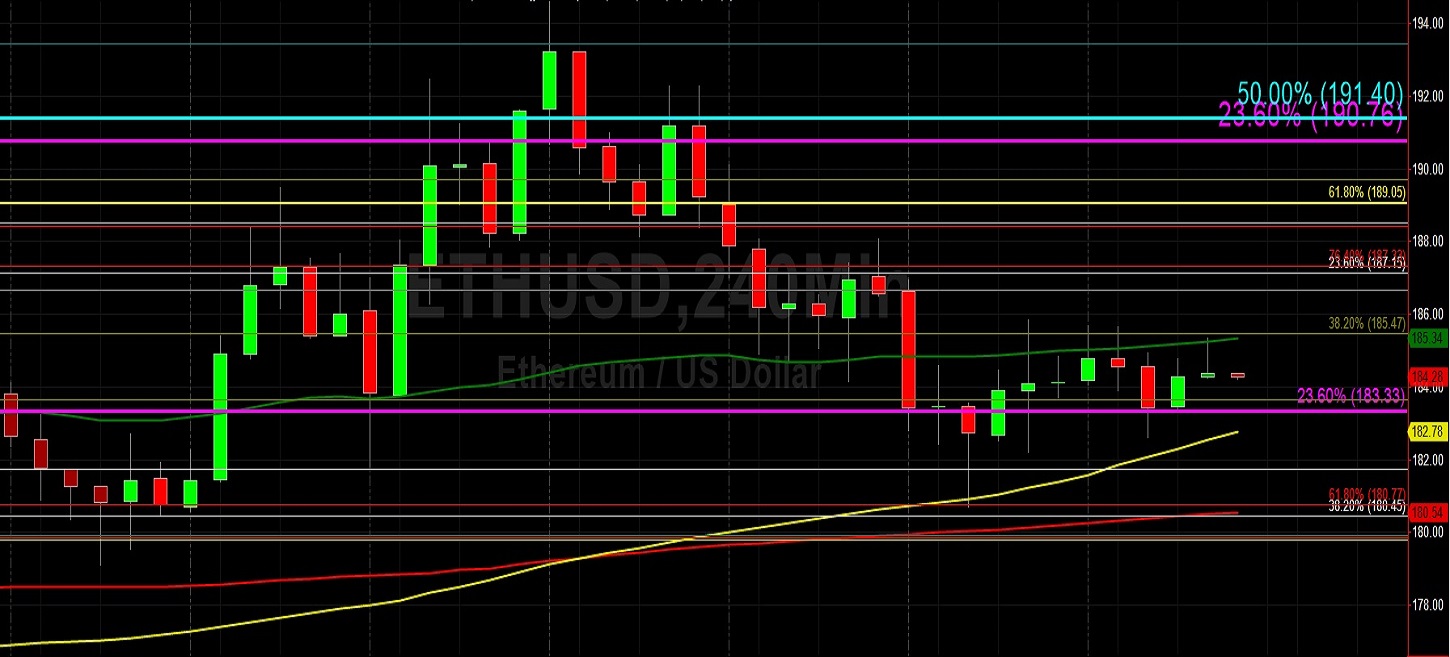
Ethereum (ETH/USD) gave back some early gains in today’s Asian session as the pair moved lower from the 185.35 area following a move higher from the 182.61 area during yesterday’s North American session. Market sentiment was dented as a result of Friday’s depreciation from the 194.60 area to the 180.71 area but the decline was relatively shallow compared with the move lower in late October that saw the 177.39 area tested. ETH/USD was supported just below the 100-bar MA (4-hourly), then indicating around the 180.93 area, and that was also right around the 61.8% retracement of the 197.93 – 153.00 range. Traders lacked the conviction to test the 200-bar MA (4-hourly), then indicating around the 180.04 area.
One indication of the weaker market bias is the pair’s movements below the 50-bar MA (hourly), 100-bar MA (hourly), and 200-bar MA (hourly). ETH/USD quickly rebounded back to the 200-bar MA (hourly) and 50-bar MA (hourly), though, and this is an indication that the move lower may have been short-lived. Following the recent depreciation, traders are paying close attention to new levels including the 186.02, 187.66, and 189.29 areas. These levels represent the 38.2% retracement, 50% retracement, and 61.8% retracements of the move from 194.60 – 180.71 range.
Price activity is nearest the 50-bar MA (4-hourly) at 185.34 and the 50-bar MA (Hourly) at 184.51.
Technical Support is expected around 180.43/ 177.39/ 175.02 with Stops expected below.
Technical Resistance is expected around 187.66/ 191.32/ 194.60 with Stops expected above.
On 4-Hourly chart, SlowK is Bullishly above SlowD while MACD is Bearishly below MACDAverage.
On 60-minute chart, SlowK is Bearishly below SlowD while MACD is Bullishly above MACDAverage.