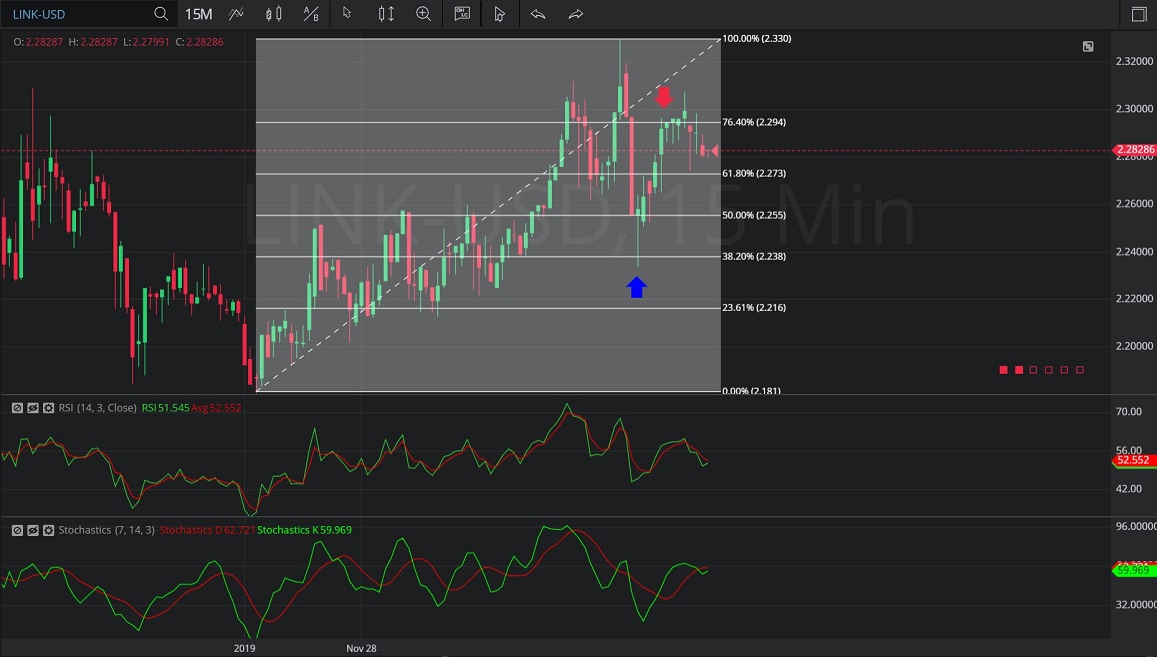
In this 15-minute chart of Chainlink/ United States dollar (LINK/USD), there is an appreciating range from 2.18001 to 2.32966.
We can see that after the appreciation, the market depreciated to the 2.2340 level (identified by the blue up arrow), trading just below the 2.237176 area, representing the 61.8% retracement of the appreciating range.
We can see the market then appreciated and traded as high as the 2.30758 area (identified by the red down arrow), above the 2.294343 area that represents the 23.6% retracement of the appreciating range.
Using RSI, we can see that RSI (14) and RSI Average (3) both had positive slopes after trading as low as 2.2340, and that the slopes of RSI (14) and RSI Average (3) turned negative after the market traded as high as 2.30758.
Using Slow Stochastics, we can see the slope of Stochastic K turned negative after the market traded as high as 2.30758, indicating a likely reversal.
Stay on top of the cryptocurrency market with CryptoDaily’s trading charts!