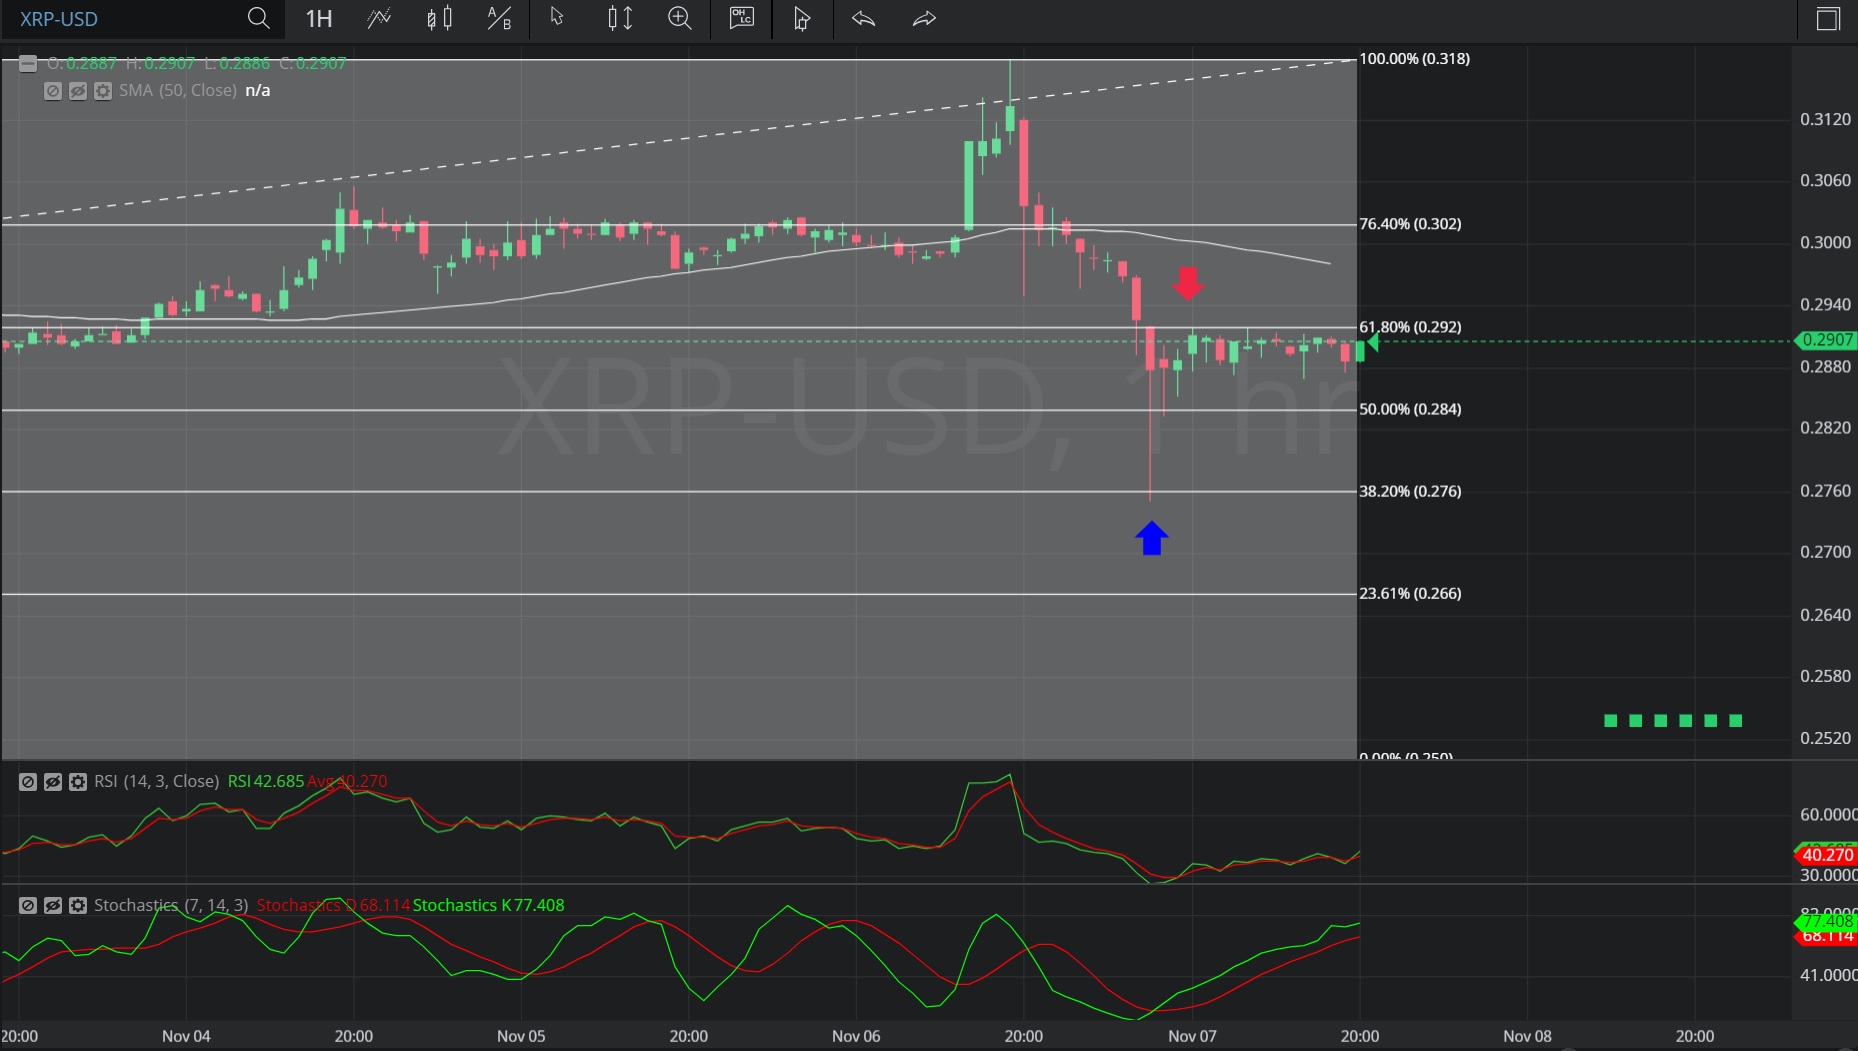
In this hourly chart of Ripple/ United States dollar (XRP/USD), we can see a depreciation from 0.3179 to 0.2751.
We can see that today the price depreciated to and tested the 0.275938 level (identified by the blue up arrow), representing the 61.8% retracement of the 0.2500 – 0.3179 range.
We can see that price activity then appreciated and tested the 0.291962 level (identified by the red down arrow), representing the 38.2% retracement of the aforementioned range.
Notably, the high of 0.2920 after the appreciation from the 0.2751 level was also right around the 38.2% retracement of 0.29145 following the depreciation from 0.3179 to 0.2751.
Using RSI, the depreciation from the 0.3179 level was confirmed by the crossover of RSI (14) below RSI Average (3) and the downward sloping RSI (14).
Using Slow Stochastics, the depreciation was also confirmed by an increasingly negative slope in both SlowK and SlowD, and a divergence between the two with SlowK crossing below SlowD.
Using RSI, the appreciation higher was confirmed the crossover of RSI (14) above RSI Average (3), and a positive slope to both RSI (14) and RSI Average (3).
Using Slow Stochastics, the appreciation higher was confirmed by the crossover of SlowK above SlowD, and a positive slope to both SlowK and SlowD.
Stay on top of the cryptocurrency market with CryptoDaily’s trading charts!