Sally Ho's Technical Analysis 4 October 2019
Bitcoin
Bitcoin (BTC/USD) depreciated to the 8086.66 level early in today’s Asian session as the pair fell back below the 8118.00 area, a short-term level of technical Support. The pair had shown some upward bias above the 8000 figure following last week’s crash to the 7712.45 area after cratering below the psychologically-important 10000 figure. Technicians continue to eye the 8505 and 8692 levels as upside price objectives above which buying pressure must emerge if the 8995 area will be challenged, representing the post-crash high after the 10000 figure gave way.
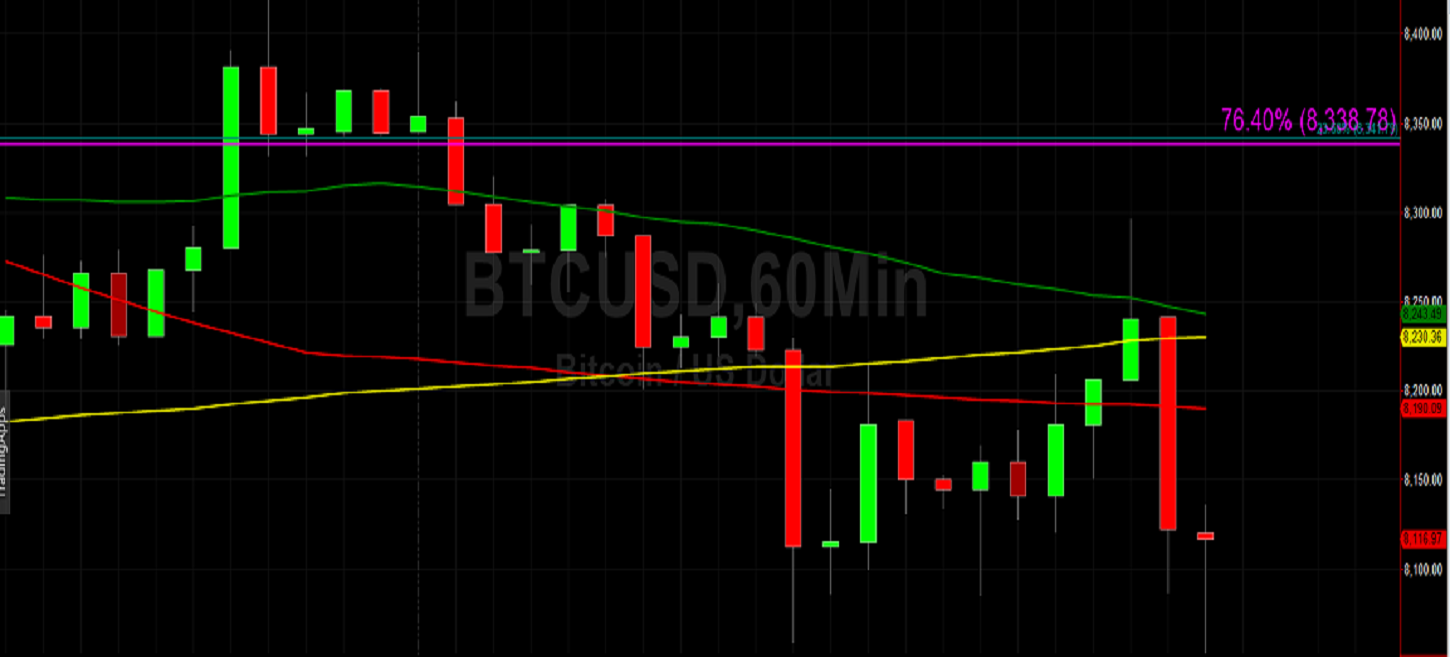
Chartists are also interested to evaluate price activity around the 8338.78 area, representing the 76.4% retracement of the 9948.12 – 3128.89 range. Some additional short-term upside price objectives include the 8731 and 8800 areas with some technical Resistance expected around the 8947 – 9045 range. Additional selling pressure could emerge around the 9360 – 9474 range and intensify around the 9749 – 9851 range heading into some technical congestion below the 10000 figure. Above that area, traders are also already observing some upward price targets around the 10108 and 10267 areas.
Price activity is nearest the 50-bar MA (4-hourly) at 8,187.35 and the 200-bar MA (Hourly) at 8,190.00.
Technical Support is expected around 7,712.45/ 7,508.77/ 7,223.25 with Stops expected below.
Technical Resistance is expected around 9,071.00/ 9,651.00/ 10,097.80 with Stops expected above.
On 4-Hourly chart, SlowK is Bullishly above SlowD while MACD is Bearishly below MACDAverage.
On 60-minute chart, SlowK is Bearishly below SlowD while MACD is Bearishly below MACDAverage.
Ethereum
Ethereum (ETH/USD) weakened early in today’s Asian session as the pair moved back to the 172.30 area after recovering from the 169.59 area during yesterday’s North American session. The recent short-term 185.89 – 173.85 range again emerged as an important one during yesterday’s Asian and European sessions after the pair’s upward momentum stalled around the 181.66 area, right around the 61.8% retracement of this range. ETH/USD Bulls lacked the strength to test the 183.05 area yesterday, representing the 76.4% retracement of this range.
The range’s relevance was reconfirmed early in yesterday’s European session when a pullback encountered buying pressure around the 176.79 area, representing the 23.6% retracement of the same range. If weakness and downward pressure persist, the 170.95 area could emerge as another important level and shift the focus to the 165.25 area, representing the 38.2% retracement of the 302.20 – 80.60 range. Below that area, additional downside price objectives include the 162.53 and 160.08 areas, with the 157.39 area below as a target that ETH/USD Bears are observing.
Price activity is nearest the 50-bar MA (4-hourly) at 172.82 and the 200-bar MA (Hourly) at 172.77.
Technical Support is expected around 167.80/ 155.50/ 147.60 with Stops expected below.
Technical Resistance is expected around 188.38/ 191.40/ 201.38 with Stops expected above.
On 4-Hourly chart, SlowK is Bullishly above SlowD while MACD is Bearishly below MACDAverage.
On 60-minute chart, SlowK is Bearishly below SlowD while MACD is Bearishly below MACDAverage.
