Litecoin
Litecoin (LTC/USD) was a little weaker early in today’s Asian session as the pair traded down around the 55.77 area following the spike to the 64.40 area during yesterday’s Asian session. Several key levels were absorbed during yesterday’s surge including a test of the 63.74 area, representing the 50% retracement of the move from 80.26 to 47.22. After traders reclaimed the 51.39 area, some additional upside price targets were reached including the 52.15 and 53.68 areas, both of which are retracement levels related to the depreciation from the 60.13 area.
The recovery from last week’s low of 47.22 was led by technical buying as Bids emerged ahead of the 47.13 area, representing the 23.6% retracement of the 127.95 – 22.17 range. Last week’s low represents the pair’s weakest print since early March and opened up a possible downward move to the 42.40 and 39.60 areas, relative lows that traded in late February. Price activity is now above the 50-bar MA (4-hourly), 100-bar MA (4-hourly), and 200-bar MA (4-hourly). Following yesterday’s appreciation, the 67.64 and 72.46 levels are upside price targets.
Price activity is nearest the 200-bar MA (4-hourly) at 55.50 and the 50-bar MA (Hourly) at 54.97.
Technical Support is expected around 52.15/ 50.25/ 47.13 with Stops expected below.
Technical Resistance is expected around 64.40/ 69.47/ 75.06 with Stops expected above.
On 4-Hourly chart, SlowK is Bearishly below SlowD while MACD is Bullishly above MACDAverage.
On 60-minute chart, SlowK is Bearishly below SlowD while MACD is Bearishly below MACDAverage.
Bitcoin Cash
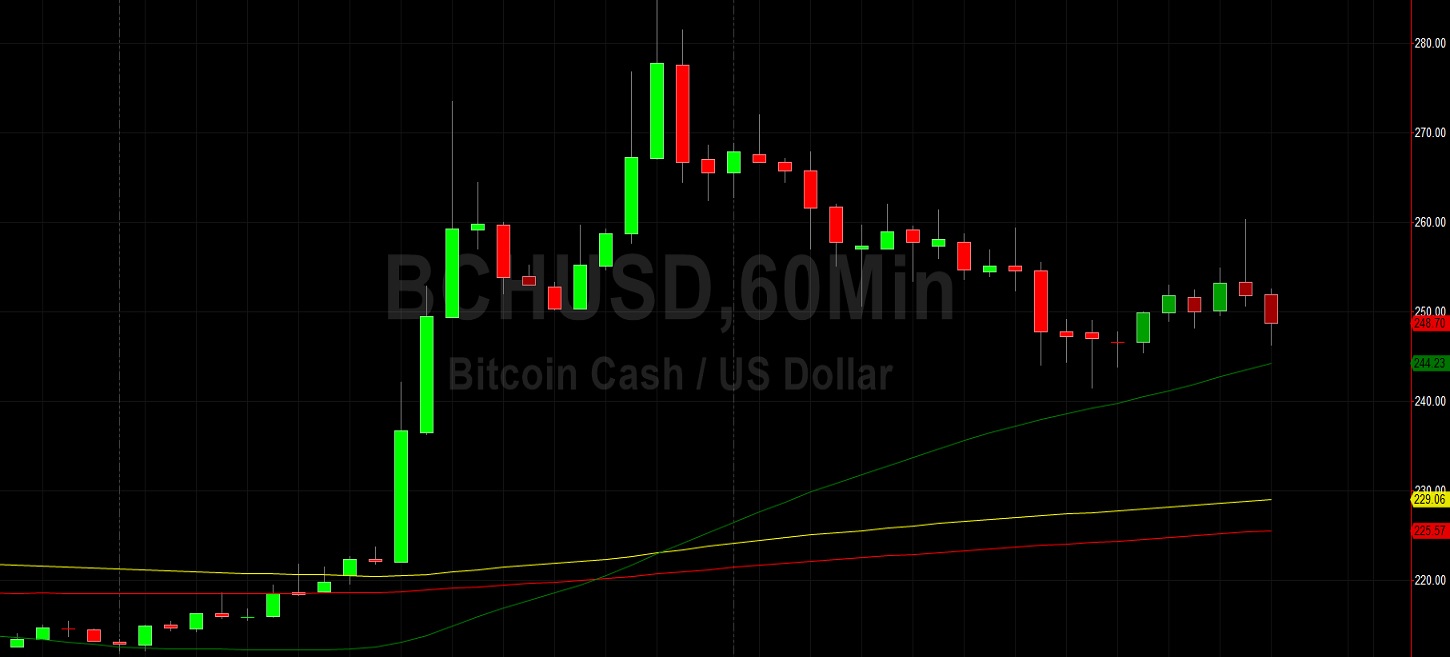
Bitcoin Cash (BCH/USD) was slightly lower early in today’s Asian session as the pair weakened to the 246.26 level after peaking around the 285.00 area during yesterday’s Asian session. The pair then steadily depreciated to the 241.53 area during yesterday’s North American session as profit-taking ensued before gaining a little bit of lost ground. The pair continues to recover from last week’s depreciation to the 197.92 area, its weakest level since April. The move lower accelerated after Stops were triggered below the 207.10 area, representing the 23.6% retracement of the 639.01 – 73.68 range.
BCH/USD managed to move back above the 50-bar MA (4-hourly), 100-bar MA (4-hourly), and 200-bar MA (4-hourly) during yesterday’s appreciation. Likewise, BCH/USD continues to trade above the 50-bar MA (hourly), 100-bar MA (hourly), and 200-bar MA (hourly), a bullish indication. One very important level that traders continue to monitor is the 243.03 area, representing the 61.8% retracement of the 73.22 – 517.75 range. Stops were also triggered above the 265.93 area, representing the 50% retracement of the 333.93 – 197.92 range, and traders will closely monitor this area on the upside. Below current market activity, traders anticipate some buying pressure around the 230.02 area.
Price activity is nearest the 200-bar MA (4-hourly) at 226.17 and the 50-bar MA (Hourly) at 244.26.
Technical Support is expected around 231.06/ 218.32/ 207.10 with Stops expected below.
Technical Resistance is expected around 265.93/ 281.97/ 301.83 with Stops expected above.
On 4-Hourly chart, SlowK is Bearishly below SlowD while MACD is Bullishly above MACDAverage.
On 60-minute chart, SlowK is Bearishly below SlowD while MACD is Bearishly below MACDAverage.