Bitcoin
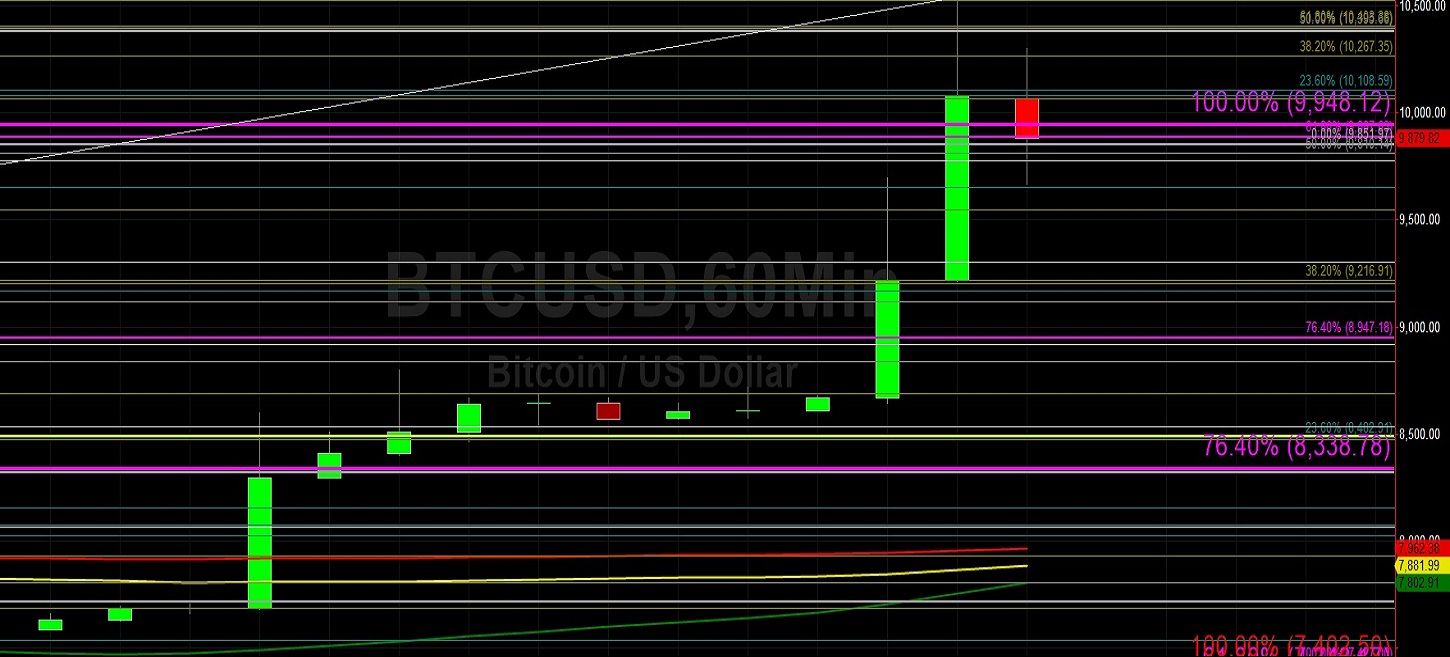
Bitcoin (BTC/USD) extended its massive rally early in today’s Asian session as the pair traded as high as the 10540.49 area, its strongest level since early September. Traders pushed the pair above the 9651 level, an area that represents the 76.4% retracement of the move from 10379.15 to 7296.44. Stops were elected above many key areas of technical Resistance along the way, including the 9117.89 and 9547.75, representing the 50% and 61.8% retracements of the move from 10939.34 to 7296.44. Market bias was aggressively altered during the move higher, underlying the appreciable volatility traders experienced this week.
Traders’ conviction really shifted in a hurry during yesterday’s North American session when the pair moved above the 8837.80 area, representing the 50% retracement of the aforementioned 10379.15 – 7296.44 range. That area had previously been toppish during the pair’s move higher this month prior to its move lower to below the 7300.00 figure. Various Stops were triggered shortly after the rally began, including above the 50-bar MA (hourly), 100-bar MA (hourly), and 200-bar MA (hourly). A round of buying was also detected above the 8265 area, representing the 200-bar MA (4-hourly). Above current market activity, traders are focusing on the 10541, 10595, and 10939 levels.
Price activity is nearest the 200-bar MA (4-hourly) at 8,252.23 and the 200-bar MA (Hourly) at 7,953.01.
Technical Support is expected around 9774.89/ 9301.26/ 8918.47 with Stops expected below.
Technical Resistance is expected around 10647.72/ 10939.34/ 11137.38 with Stops expected above.
On 4-Hourly chart, SlowK is Bullishly above SlowD while MACD is Bullishly above MACDAverage.
On 60-minute chart, SlowK is Bearishly below SlowD while MACD is Bullishly above MACDAverage.
Ethereum
Ethereum (ETH/USD) rocketed higher early in today’s Asian session as the pair traded as high as the 199.50 area, stopping just short of the psychologically-important 200.00 figure. Stops were triggered above the 197.93 area during the move higher, a previous relative high from 11 October, and this propelled the pair to multi-week highs. Stops were elected at many levels during the move higher, including the 187.33 area which represents the 76.4% retracement of the 197.93 – 153.00 range. Also, Stops were hit above the 180.77 and 175.47 levels during the appreciation, the 61.8% and 50% retracements of the same range.
Market sentiment started to shift abruptly after the pair moved above the 174.05 and 178.00 levels, recent relative highs. It remains to be seen how sustainable this move higher will be. Above current market activity, the 207.58, 218.86, and 224.71 areas represent upside price obectives. Below current market activity, traders will pay close attention to the 188.53 area, representing the 23.6% retracement of the move from 153.00 to 199.50. Also, the 181.74 and 176.25 areas represent the 38.2% and 50% retracements of the same range.
Price activity is nearest the 200-bar MA (4-hourly) at 177.09 and the 200-bar MA (Hourly) at 170.70.
Technical Support is expected around 188.53/ 181.74/ 176.25 with Stops expected below.
Technical Resistance is expected around 202.38/ 207.58/ 224.71 with Stops expected above.
On 4-Hourly chart, SlowK is Bullishly above SlowD while MACD is Bullishly above MACDAverage.
On 60-minute chart, SlowK is Bullishly above SlowD while MACD is Bullishly above MACDAverage.