Bitcoin
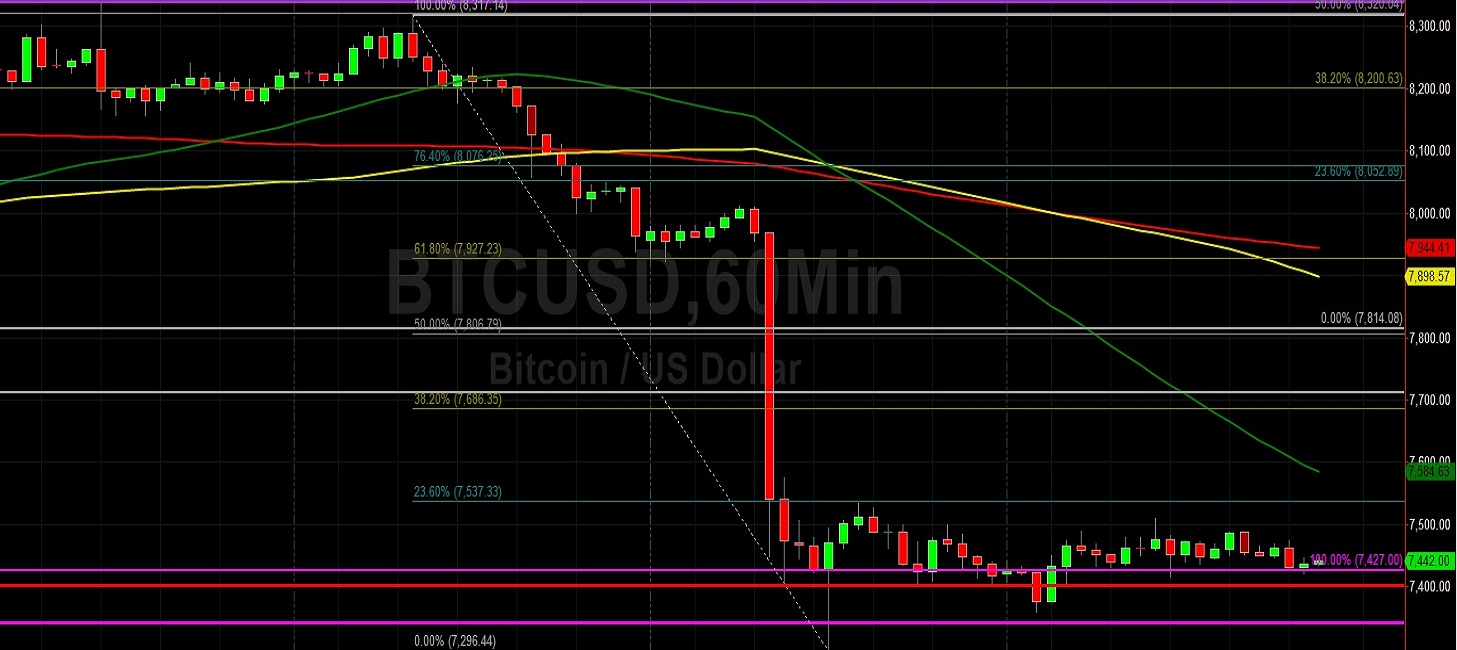
Bitcoin (BTC/USD) traded sideways early in today’s Asian session as the pair traded as high as the 7446.37 area after trading as low as the 7359.48 area during yesterday’s European session. Traders continue to react to the pair’s worsening market sentiment following this week’s massive depreciation from the 8349.84 area that saw Bids tested around the 7296.44 area during Wednesday’s North American session, its weakest print since May. Following the decline, one of the key levels that has emerged is the 7537.33 area, representing the 23.6% retracement of the 8314.14 – 7296.44 range.
The significance of the 7537.33 area became evident when selling pressure emerged around this level in the aftermath of the sharp depreciation, an indication that technicians have been able to keep a lid on BTC/USD’s post-crash recovery with their Offers. The pair has since traded sideways, and the 50-bar MA (hourly) has bearishly crossed below the 100-bar MA (hourly) and 200-bar MA (hourly). If the market is able to move higher beyond the 7537.33 area, the pair’s next upside challenge will be 7686.35, representing the 38.2% retracement of the same range. Below current market activity, the 7235.95 and 7084.98 areas represent downside areas of potential technical Support.
Price activity is nearest the 50-bar MA (4-hourly) at 7,937.18 and the 50-bar MA (Hourly) at 7,584.59.
Technical Support is expected around 7,235.95/ 7,147.97/ 6,865.68 with Stops expected below.
Technical Resistance is expected around 7,814.08/ 8,130.75/ 8,560.50 with Stops expected above.
On 4-Hourly chart, SlowK is Bullishly above SlowD while MACD is Bearishly below MACDAverage.
On 60-minute chart, SlowK is Bearishly below SlowD while MACD is Bullishly above MACDAverage.
Ethereum
Ethereum (ETH/USD) was largely rangebound early in today’s Asian session as the pair traded as high as the 161.15 level after trading as low as the 159.83 area during yesterday’s North American session. Market bias clearly remains negative following the pair’s significant losses this week that saw it depreciate from the 178.00 figure to the 153.00 figure, it weakest level since the low of 152.11 on 26 September. During the pair’s rapid but temporary move higher to the 174.05 area following its quick depreciation lower to multi-week lows, many traders were wrongfooted by the ensuing volatility that saw another collapse back down to the 157.18 level.
ETH/USD has since been capped around the 162.92 area, right around the 76.4% retracement of the move from 152.11 to 197.93. If traders are able to eclipse this level, the 163.60 area will come into view, representing the 23.6% retracement of the 197.93 – 153.00 range. Additional upside price retracement targets include the 165.50, 167.80, and 168.45 levels. Chartists will also continue to focus on the 165.25 area, representing the 38.2% retracement of the move from 302.20 to 80.60. Price activity remains well below the 50-bar MA (4-hourly) and 50-bar MA (hourly).
Price activity is nearest the 50-bar MA (4-hourly) at 170.77 and the 50-bar MA (Hourly) at 162.57.
Technical Support is expected around 153.00/ 146.00/ 136.34 with Stops expected below.
Technical Resistance is expected around 175.02/ 180.45/ 183.33 with Stops expected above.
On 4-Hourly chart, SlowK is Bearishly below SlowD while MACD is Bearishly below MACDAverage.
On 60-minute chart, SlowK is Bullishly above SlowD while MACD is Bullishly above MACDAverage.